


This study focuses on a dataset related to cultural heritage, represented by textual input sequences \(\:X=\left\{{W}_{1}\dots\:,{W}_{n}\right\}\). The goal is to extract sentiment quadruples, defined as (ac, at, sp, ot), where:
-
\(\:ac\) is the aspect term,
-
\(\:at\) is the aspect category,
-
\(\:sp\) is the sentiment polarity, and.
-
\(\:ot\) is the opinion term.”
The sentiment polarity sp is categorized into five distinct classes: negative, slightly negative, neutral, slightly positive, and positive. The aspect categories at are organized into two hierarchical levels: primary and secondary indicators. The primary indicators encompass five overarching dimensions, which are further broken down into eighteen secondary indicators, as shown in Table 1.
The aspect term (ac) and opinion term (ot) are text spans explicitly identified within the input sentence \(\:X\). In cases where these terms are implied or absent, they are denoted as “NULL.” The extraction task aims to capture public sentiments and their corresponding reasons across multiple dimensions, providing granular insights into the public experience within the historical context of Lijiang Ancient Town.
Overall framework
The proposed ASQP model consists of three sequential phases: Phase 1 (LoRA-based data augmentation), Phase 2 (entity recognition), and Phase 3 (aspect category and sentiment classification with SHAP for interpretability). This design simplifies the overall workflow while maintaining robustness in handling noisy cultural heritage data (Fig. 3).

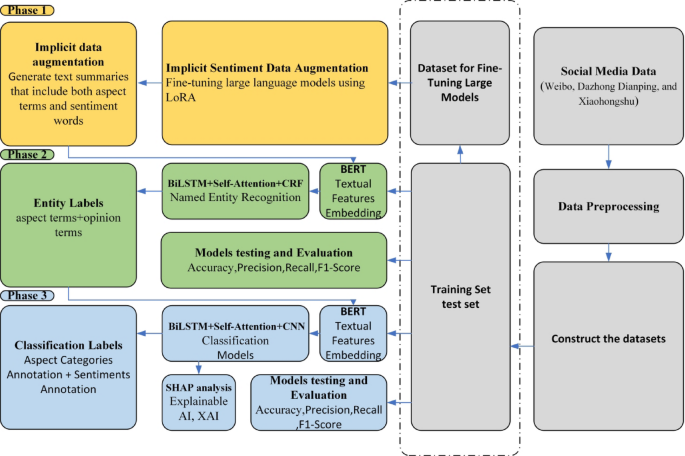
In Phase 1, large language models (LLMs) are fine-tuned using LoRA (Low-Rank Adaptation) to generate augmented training data. This produces text summaries that explicitly include aspect categories and sentiment labels, enriching the dataset with implicit emotional cues that are often absent in raw social media text.
In Phase 2, entity recognition is performed using a hybrid model that integrates BERT, multi-layer BiLSTM, multi-head self-attention, and Conditional Random Fields (CRF).
-
BERT provides contextual embeddings for nuanced text understanding.
-
BiLSTM captures long-range dependencies between tokens.
-
Multi-head self-attention enables simultaneous focus on multiple parts of a sentence.
-
CRF ensures sequential accuracy in tagging aspect and opinion terms.
This stage follows a BIO (Begin, Inside, Outside) tagging scheme to extract aspect and opinion terms, even when they are implicit or ambiguous.
In Phase 3, the extracted entities are further processed by a classification model that combines BERT, BiLSTM, self-attention, and CNN. The system assigns each entity to predefined categories (e.g., Cultural Experience, Facility Quality) and sentiment polarities across five levels (negative, slightly negative, neutral, slightly positive, positive). To enhance interpretability, SHAP analysis is applied, revealing the contribution of words and phrases to sentiment predictions. This transparency provides heritage managers with actionable insights into which cultural or spatial factors most strongly shape public perception.
Implicit data augmentation
Social media reviews often convey multiple sentiment aspects but lack explicit aspect terms and sentiment words. Emotional cues are often conveyed indirectly through context or phrasing. For example, “The service could have been faster” implies dissatisfaction with speed, even though explicit negative words like “bad” or “slow” are not used. Capturing these implicit sentiments is crucial for a nuanced understanding of public perceptions, especially in cultural heritage contexts.
This study proposes implicit data augmentation by generating sentiment-enriched data using Large Language Models (LLMs). Implicit data augmentation generates training examples where unspoken sentiments are made explicit. For example, the review “The service could have been faster” can be augmented to “The service was not fast enough, leading to dissatisfaction,” making the implicit sentiment explicit. This helps the model identify sentiments implied through contextual cues, improving its ability to handle indirect emotional expressions.
In this work, LLMs are not directly used as the discriminative ASQP predictor. Instead, they are employed in a generative role to create augmented, sentiment-enriched training data, which is then used to train a separate discriminative ASQP model. Fine-tuned LLMs are used to generate sentiment-enriched data by summarizing input reviews with aspect terms (e.g., “service”) and sentiment words (e.g., “slow” or “unsatisfactory”). This method enables the model to better process subtle public sentiments and improves performance in Aspect Sentiment Quadruple Prediction (ASQP).
Fine-tuning Large Language Models (LLMs) is a well-established method for adapting pre-trained models to specific tasks using task-specific data22. However, pre-trained LLMs often lack the specific capabilities required for Aspect Sentiment Quadruple Prediction (ASQP). Here, the LLM is fine-tuned for the data augmentation stage by minimizing the cross-entropy loss function:
$$\:{L}_{CE}=-\frac{1}{n}\sum\:_{i=1}^{n}\:\text{l}\text{o}\text{g}p\left({y}_{i}\mid\:x,{y}_{
(1)
where \(\:n\) is the length of the output sequence \(\:y\), and \(\:p\left({y}_{i}\mid\:x,{y}_{ represents the probability of predicting the next token \(\:{y}_{i}\) conditioned on the input sequence \(\:x\) and previous tokens \(\:{y}_{.
Given the large parameter scale of LLMs23, Parameter-Efficient Fine-Tuning (PEFT) techniques like Low-Rank Adaptation (LoRA) are employed to reduce computational costs (Fig. 4). LoRA introduces trainable low-rank matrices alongside the frozen parameters of the pre-trained model, allowing efficient fine-tuning with fewer resources.
where \(\:{W}_{0}\) denotes the fixed parameters of the original model, \(\:A\) maps input to a lower-dimensional space, and \(\:B\) maps it back to the original dimensional space. In this implementation, the rank \(\:r\) of matrices \(\:A\) and \(\:B\) is set to 8. Matrix \(\:B\) is initialized to zero, while \(\:A\) is initialized with a Gaussian distribution \(\:(\mu\:=0,\sigma\:=0.02)\) to facilitate stable convergence.

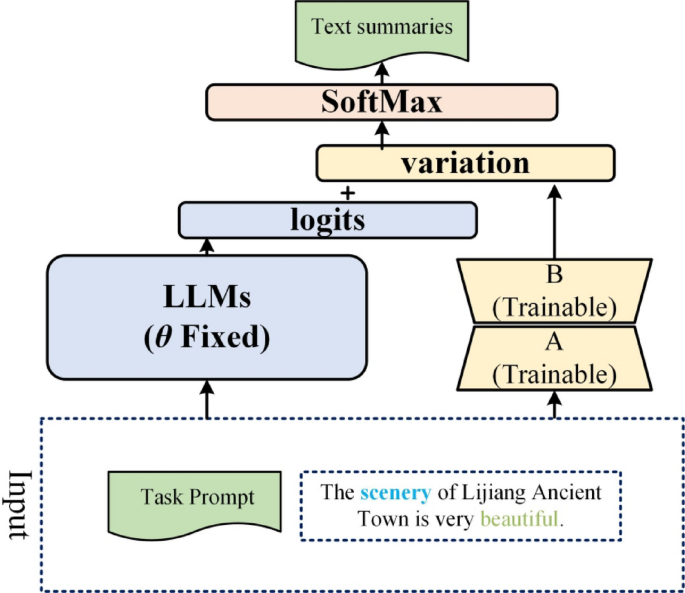
Training approach for LLMs using low-rank adaptation (LoRA).
Major model structures
The proposed ASQP model integrates advanced computational methods across three main layers: embedding, implicit feature extraction, and sentiment classification. The implicit feature extraction layer, consisting of dual-layer BiLSTM, multi-head self-attention, and CNN, effectively captures subtle textual features critical for accurate sentiment analysis (Fig. 5).

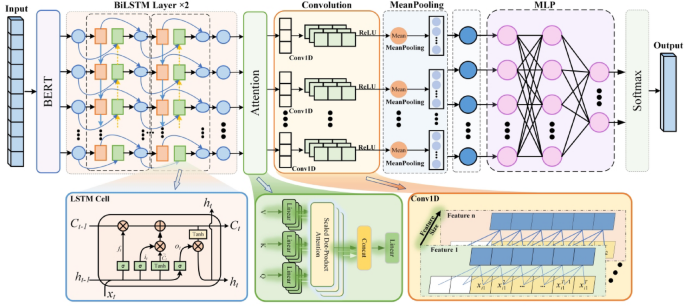
Diagram of the main model structure for the ASQP task.
In this model, BERT (Bidirectional Encoder Representations from Transformers) is employed exclusively for generating textual embeddings—numerical representations of text that capture semantic meaning24. BERT is advantageous for embedding text due to its capability to capture complex language structures and context-dependent meanings25. BERT transforms input text into vectors (embeddings) by considering both preceding and following context simultaneously, thus providing more meaningful representations of words within sentences.
The dual-layer BiLSTM component enhances the model’s capacity to handle sequential data by processing textual information from both forward (beginning-to-end) and backward (end-to-beginning) directions simultaneously26. Each BiLSTM layer captures intricate relationships between words, retaining context-rich information important for sentiment analysis27. Utilizing two layers allows deeper comprehension of complex and nuanced sentiments typically expressed by visitors, such as subtle positive or negative experiences in historical environments.
Following BiLSTM, the multi-head self-attention mechanism highlights the most informative parts of the text by weighing different words according to their significance. This approach effectively identifies key phrases or sentences that have a strong influence on overall sentiment. Subsequently, a convolutional neural network (CNN) consolidates multiple attention-derived features into a single, refined feature set, simplifying the data and reducing irrelevant details or noise.
The final sentiment classification layer uses these refined textual features to categorize the extracted sentiments into clearly defined categories, such as positive, neutral, or negative. This integration of embedding, sequential modeling, attention mechanisms, and feature refinement results in a robust and interpretable sentiment analysis framework.
CRF is used to refine entity extraction by modeling the sequential dependencies between aspect and opinion terms, ensuring accurate tagging of extracted entities in the context of sentiment analysis.
Incorporating SHAP (SHapley Additive exPlanations) into the framework, Fig. 6 illustrates the process of attributing feature importance for sentiment predictions. This flowchart demonstrates how SHAP values identify key words or aspects that influence the model’s decision-making, enhancing the transparency and interpretability of sentiment analysis in cultural heritage contexts.

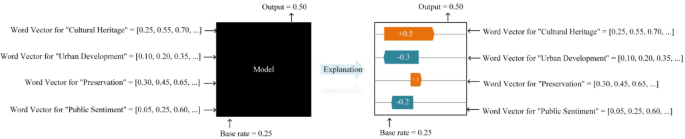
SHAP feature importance flowchart.
Loss function
The loss function in the proposed Aspect Sentiment Quadruple Prediction (ASQP) model integrates three distinct components, each tailored to address specific subtasks: entity extraction, aspect category classification, and sentiment polarity classification.
For the entity extraction task, we utilize the Conditional Random Field(CRF)layer, employing the negative log-likelihood loss, defined as:
$$\:{L}_{CRF}=-\sum\:_{i=1}^{n}\:\text{log}p\left({y}_{i}\mid\:{x}_{i}\right)$$
(3)
where \(\:{y}_{i}\) represents the correct tag sequence, \(\:{x}_{i}\) is the input sequence, and \(\:p\left({y}_{i}\mid\:{x}_{i}\right)\) denotes the conditional probability of the correct tag sequence predicted by the CRF༎.
For the aspect category classification task, we employ the standard cross-entropy loss, calculated as:
$$\:{L}_{\text{category}}=-\sum\:_{i=1}^{N}\:{y}_{i}\text{l}\text{o}\text{g}\left({\hat{y}}_{i}\right)$$
(4)
where \(\:{y}_{i}\) is the ground-truth category label, \(\:{\stackrel{\prime }{y}}_{i}\) is the predicted probability for the correct category, and \(\:N\) is the total number of samples༎.
For sentiment polarity classification, the cross-entropy loss function is similarly applied:
$$\:{L}_{\text{sentiment}}=-\sum\:_{i=1}^{N}\:{s}_{i}\text{l}\text{o}\text{g}\left({\hat{s}}_{i}\right)$$
(5)
where \(\:{s}_{i}\) represents the actual sentiment label and \(\:{\stackrel{\prime }{s}}_{i}\) is the predicted probability of the sentiment polarity༎.
Study subjects
Lijiang Ancient Town, a UNESCO World Heritage site in northwestern Yunnan, China, is known for its well-preserved traditional architecture, unique Naxi culture, and harmonious integration with nature (Fig. 7).

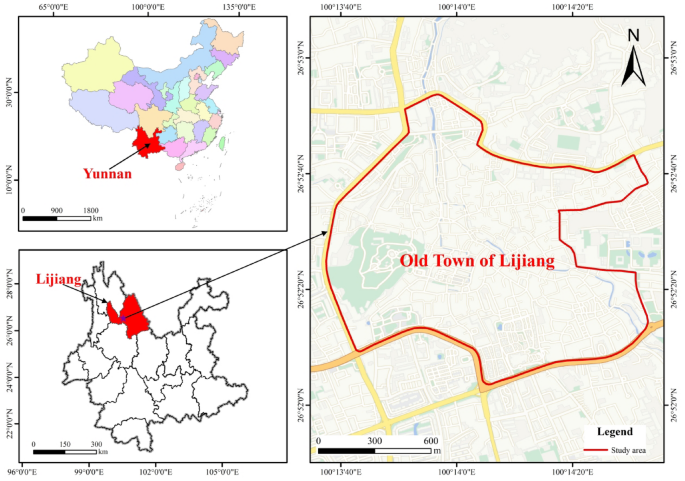
Location map of lijiang ancient town. map showing the geographical location of lijiang ancient town in yunnan province, china, and regional boundaries. boundary data source: https://www.tianditu.gov.cn.
However, rapid tourism growth has posed challenges to both heritage conservation and community dynamics, making it an ideal case for exploring sentiment analysis in heritage conservation (Fig. 8).

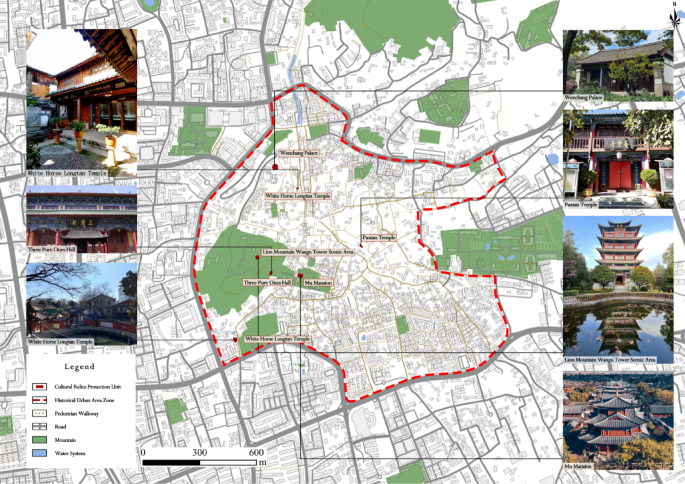
Cultural heritage and urban layout of lijiang ancient town. map showing the historical urban area zone, cultural relic protection units, pedestrian walkways, roads, mountains, and water systems within lijiang ancient town. locations of major landmarks are marked, including white horse longtan temple, three pure ones hall, wenchang palace, pu xian temple, lion mountain wanggu tower scenic area, and mu mansion. boundary data source: other map data source: https://www.mapbox.com.
Experiment and datasets
The datasets utilized in this study were sourced from prominent Chinese social media platforms—Weibo, Dazhong Dianping, and Xiaohongshu—covering reviews from 2018 to 2024 related to Lijiang Ancient Town. Rigorous preprocessing was conducted to remove duplicates, irrelevant posts, advertisements, and entries with insufficient detail, yielding a refined dataset of 32,074 textual entries. A representative subset, comprising approximately one-third of the total data, was selected for annotation, specifically tailored to the study’s analytical needs. Each annotated entry clearly defined sentiment quadruples, including aspect terms, aspect categories, sentiment polarities (positive, negative, neutral), and associated opinion words.
Accurate annotation is critical to developing reliable sentiment analysis models. Given the unique context of heritage tourism and nuanced sentiments in public reviews of Lijiang Ancient Town, a specialized annotation framework was established. Annotation guidelines drew on authoritative references including the Nara Document on Authenticity (ICOMOS, 1994), the World Heritage Convention, and the ICOMOS International Cultural Tourism Charter (1999), ensuring thematic coherence and analytical rigor. The annotation process was performed by a team comprising five postgraduate students and one doctoral candidate specializing in architecture, employing NVivo software for systematic data coding. Each textual entry received dual annotations to ensure accuracy and consistency. The initial Kappa value (0.56) was largely attributed to two factors: (i) the semantic proximity of sentiment polarity categories such as ‘slightly positive’ vs. ‘positive’ and ‘slightly negative’ vs. ‘negative’; and (ii) overlaps between similar aspect categories, for example “Modernization and Personalized Experience” vs. “Authenticity and Integrity of Heritage,” “Dining and Accommodation Services” vs. “Commercialized Experience,” or “Authenticity and Integrity of Heritage” vs. “Historical Narrative and Educational Depth.” In addition, the prevalence of implicit sentiment expressions in culturally nuanced contexts further complicated annotation. Discrepancies were first discussed between the two annotators; unresolved cases were escalated to the architectural professor and associate professor for final arbitration, ensuring consensus on ambiguous sentiment expressions. To improve consistency, the annotation guidelines underwent multiple rounds of refinement and pilot re-annotation. Specifically, a 15% subset of the dataset—comprising both randomly selected texts and previously contentious cases—was repeatedly re-annotated after each guideline update. This iterative process ensured that the revised framework was tested against both typical and ambiguous samples. As a result, inter-annotator agreement progressively improved, ultimately achieving a high Cohen’s Kappa value of 0.87, confirming the robustness of the updated guidelines.
Throughout the annotation process, categories were continuously refined, and each text entry was systematically annotated with a sentiment quadruple comprising aspect terms (specific features mentioned in reviews), aspect categories (broader thematic classifications), opinion words (words expressing specific sentiments), and sentiment polarities. The sentiment polarities were encoded as Negative (0), Slightly Negative (1), Neutral (2), Slightly Positive (3), and Positive (4).
Experimental setup and evaluation metrics
Experiments were conducted using Python 3.13.5 on a system equipped with an NVIDIA RTX 5090 GPU and an AMD Ryzen 9 9950 × 3D CPU (16 cores, 32 threads). Models were implemented in PyTorch (version 2.7.0 + cu128), with the HuggingFace Transformers library (version 4.54.1) for embedding extraction, running on CUDA 12.8. The pre-trained BERT-base-cased model provided initial token embeddings with an encoding dimension of 768, and the BERT parameters were frozen throughout training to mitigate overfitting. The embeddings served as inputs to a dual-layer BiLSTM, configured with a hidden state dimension of 768 to effectively capture sequential contextual relationships. An 8-head self-attention mechanism was applied to emphasize salient text features, followed by a convolutional layer equipped with five 5 × 5 kernels for further feature refinement. Optimization was performed using the AdamW optimizer with a learning rate of 5e-5, a batch size of 32, and a maximum input sequence length of 256 tokens.
The performance of the Aspect Sentiment Quadruple Prediction (ASQP) model is assessed using several standard metrics commonly employed in classification tasks, namely Accuracy (Acc), Precision (P), Recall (R), F1-Score (F1). These metrics offer a comprehensive understanding of the model’s ability to accurately classify aspects, sentiments, and opinions in the context of heritage environment perception.
Accuracy quantifies the proportion of correct predictions made by the model, calculated as the ratio of correct predictions to the total number of predictions. Specifically, it is given by the formula:
$$\:\text{Accuracy}=\frac{TP+TN}{TP+TN+FP+FN}$$
(7)
where TP refers to True Positives (correctly predicted positive instances), TN denotes True Negatives (correctly predicted negative instances), FP represents False Positives (incorrectly predicted as positive), and FN indicates False Negatives (incorrectly predicted as negative).
Precision measures the accuracy of the model’s positive predictions. It is calculated as the ratio of True Positives to the total number of predicted positives, expressed as:
$$\:\text{Precision}=\frac{TP}{TP+FP}$$
(8)
where TP is the number of True Positives, and FP is the number of False Positives.
Recall, also known as Sensitivity or the True Positive Rate, evaluates the model’s ability to identify all relevant positive instances. It is computed as the ratio of True Positives to the total actual positives, as shown by:
$$\:\text{Recall}=\frac{TP}{TP+FN}$$
(9)
where TP is the number of True Positives, and FN is the number of False Negatives.
The F1-Score provides a balanced measure of Precision and Recall by calculating their harmonic mean. This metric is particularly useful for evaluating models on imbalanced datasets, and is defined as:
$$\:\text{F1-Score}=2\times\:\frac{\text{Precision}\times\:\text{Recall}}{\text{Precision}+\text{Recall}}$$
(10)
where Precision and Recall are as defined above.
link