


Spatial distribution analysis of Intangible Cultural Heritage
Using ArcGIS 10.5 software, the spatial distribution of intangible cultural heritage (ICH) elements was visualized, as shown in Fig. 2a. In terms of geographical distribution, the Hu Line serves as a significant dividing boundary. Eastern Region (East of the Hu Line): The distribution of ICH elements is notably dense, with a total of 3004 ICH items, accounting for 83.2% of the national total. Western Region (West of the Hu Line): The distribution is comparatively sparse, with only 606 ICH items, representing 16.8% of the national total. This pattern reflects a spatial trend of “dense in the east and sparse in the west.”

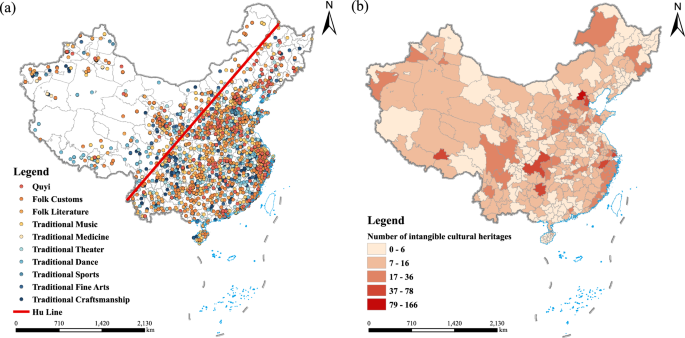
a Spatial distribution of ICH. b Quantity Classification of ICH.
Regarding the categorical composition of ICH, China systematically classifies its ICH elements into ten primary categories based on their forms of expression and content characteristics: Quyi (Chinese performing storytelling), Folk Customs, Folk Literature, Traditional Music, Traditional Medicine, Traditional Theater, Traditional Dance, Traditional Sports, Traditional Fine Arts, and Traditional Craftsmanship. The overall distribution of these categories is visualized in Fig. 2a. Figure 3a further delineates the proportional structure across categories. Analysis reveals a relatively balanced distribution among categories, with Traditional Craftsmanship constituting the largest share, while Traditional Sports, Traditional Medicine, and Quyi exhibit comparatively fewer representative elements. This structural equilibrium reflects China’s holistic conservation philosophy in ICH safeguarding, emphasizing comprehensive coverage and systematic protection of diverse cultural expressions.

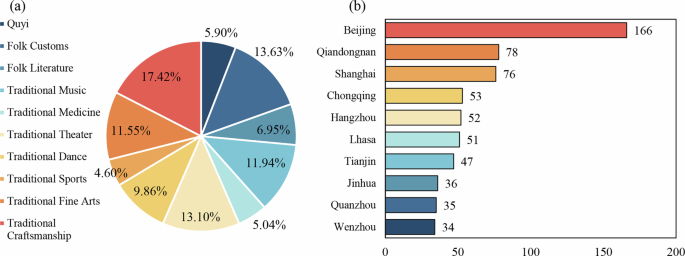
a Category composition of ICH. b Top 10 cities in terms of ICH quantity ranking.
From an urban perspective (Figs. 2b, 3b), the distribution of ICH items also exhibits significant regional variation: Beijing, as the cultural nucleus, has the highest number of ICH sites, totaling 166. Qiandongnan Miao and Dong Autonomous Prefecture ranks second with 78 sites, leveraging its distinctive ethnic cultural heritage, followed closely by Shanghai with 76 sites. Hangzhou, Chongqing, and Lhasa each contain more than 50 ICH sites. This pronounced spatial configuration further validates the spatially heterogeneous agglomeration of China’s ICH resources, underscoring the regionally differentiated character of cultural resource distribution.
To further illustrate the spatial distribution pattern of traditional villages, this study employed the kernel density analysis method to derive the overall distribution pattern of 3610 intangible cultural heritage (ICH) items across China. The resulting kernel density map is presented in (Fig. 4). The distribution of ICH exhibits a distinct pattern characterized by “two cores, three belts, and multiple scattered points.” The “two cores” refers to the two high-density areas in the Yangtze River Delta and the Beijing-Tianjin-Hebei region. These regions have historically been densely populated and possess profound historical and cultural legacies, providing favorable conditions for the emergence and preservation of ICH. The “three belts” pattern includes the Yellow River middle and lower reaches density belt, the Yangtze River middle and lower reaches density belt, and the southeast coastal density belt. These regions, situated along major rivers and coastal areas, benefit from favorable natural conditions and have a long history of economic and cultural development. Historically, these areas have been among China’s most economically developed regions, fostering diverse ICH traditions. Notably, the fishing culture and water-town traditions in the middle and lower reaches of the Yangtze and Yellow Rivers have given rise to ICH elements such as fishing songs and hunting traditions. The southeast coastal areas, rich in marine resources, have cultivated ICH forms related to marine fisheries, navigation techniques, and maritime folklore. Beyond the two core regions and three belts, ICH elements also tend to cluster around provincial administrative centers. These centers serve as political and economic hubs within their respective provinces and are characterized by high population densities, further contributing to the concentration of ICH elements.

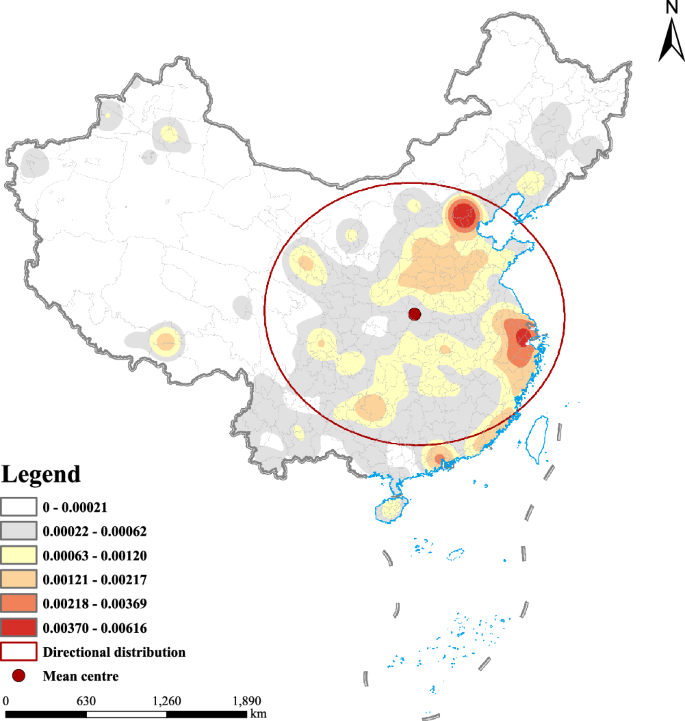
Kernel density and directional distribution of Intangible Cultural Heritage in China.
Figure 4 illustrates both the directional distribution trend and the average geographic center of intangible cultural heritage (ICH) elements, while Table 2 provides the specific parameters of the standard deviation ellipse for ICH distribution. By analyzing the data from both the figure and the table, the following observations can be made:
-
The ellipticity of the standard deviation ellipse is 0.12, indicating that its shape is nearly circular. This suggests that the spatial distribution of ICH elements does not exhibit a significant directional bias.
-
The spatial centroid of ICH elements is located southeast of China’s geometric geographic center (103.40°E, 36.03°N).
-
This spatial shift implies that ICH elements are more densely concentrated in the eastern provincial regions, whereas the northwestern inland areas exhibit a relatively lower density of ICH elements.
A global spatial autocorrelation analysis was conducted on intangible cultural heritage (ICH), yielding a Moran’s I index value of 0.003369. While the relationship between data points is not particularly strong, a certain degree of positive spatial autocorrelation is still evident.
-
The z-value of 5.880099 is significantly greater than 1.65, indicating that the Moran’s I index is notably higher than the expected value under a random spatial distribution. This confirms that ICH elements exhibit a clustered distribution.
-
The p-value of 0.000000 is less than 0.01, allowing us to reject the null hypothesis of a random distribution at the 99% confidence level. This suggests that ICH elements are significantly spatially autocorrelated.
-
The high-low clustering analysis produced a z-score of 6.447883 and a p-value of 0.000000, further confirming that ICH elements exhibit high-value clustering, a result that is statistically significant.
Given the evidence of positive spatial autocorrelation and high-value clustering, a local spatial autocorrelation analysis was conducted to further investigate spatial clustering patterns.
-
The local Moran’s I index was calculated to identify clusters and outliers in the spatial distribution of ICH elements.
-
The Getis-Ord Gi* statistic was employed to detect hot spots and cold spots, providing deeper insights into the spatial distribution characteristics of ICH.
The results of the spatial autocorrelation calculations are presented in Fig. 5a. The spatial clustering patterns of intangible cultural heritage (ICH) elements can be categorized as follows:
Fig. 5: Local spatial autocorrelation. 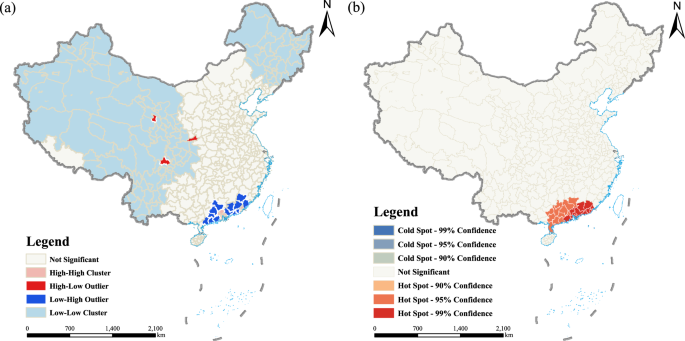
a Clustering and outlier testing of ICH. b Cold and hotspot analysis of ICH.
-
High-High (H-H) Clusters: These clusters appear in the Pearl River Delta urban agglomeration, as well as in Chaozhou and Shantou, indicating that these areas serve as hotspots for ICH, surrounded by other high-value regions.
-
High-Low (H-L) Clusters: These represent high-value areas surrounded by low-value regions, primarily including the cities of Xi’an, Chengdu, and Xining.
-
Low-High (L-H) Clusters: These areas exhibit low ICH values but are adjacent to high-value regions. Examples include most cities in Guangdong Province (excluding Zhanjiang and Shaoguan), as well as Zhangzhou and Longyan in Fujian Province.
-
Low-Low (L-L) Clusters: These clusters are predominantly found in western and northeastern China, where ICH elements are sparsely distributed.
-
The hotspot analysis results (Fig. 5b) further reveal that:
-
ICH hotspots are primarily concentrated in certain cities in southeastern Guangxi Zhuang Autonomous Region and Guangdong Province.
-
No cold spots were identified in the spatial distribution of ICH elements.

A comprehensive analysis of these spatial patterns indicates that the distribution of ICH exhibits significant regional disparities and is influenced by spatial effects. Given these findings, it is essential to investigate the factors driving ICH distribution. When conducting regression analysis, relying solely on Ordinary Least Squares (OLS) regression is insufficient, as it does not account for spatial dependencies. Instead, it is necessary to employ spatial regression models that explicitly consider spatial factors and interactions to ensure more accurate and reliable results.
Analysis of the impact mZechanism of Intangible Cultural Heritage
Currently, Ordinary Least Squares (OLS) regression and Geographically Weighted Regression (GWR)28 are widely employed as fundamental models in spatial relationship studies. However, the accuracy of these models remains limited, necessitating further improvements. The traditional OLS model assumes that the relationships between spatial variables are fixed and do not change with location. This assumption contradicts the spatial heterogeneity and non-stationarity observed in real-world geographical phenomena. The GWR model addresses this limitation by fitting a local regression model at each location, thereby capturing spatial heterogeneity. However, it assumes that all processes operate at a single spatial scale, overlooking the scale-dependent variations of different independent variables.
The Multiscale Geographically Weighted Regression (MGWR) model29,30 improves upon the GWR model by allowing for spatially varying parameter estimates and generating a unique optimal bandwidth for the relationship between the dependent variable and each independent variable. This capability enables the model to account for spatial variations across different scales, providing a more nuanced understanding of geographical processes. Existing studies have shown that it has advantages over the traditional OLS and GWR models in studying spatial heterogeneity in the spatial patterns of traditional villages31, second-hand housing prices32 and the economic development of Chinese counties33. Therefore, this study introduces the MGWR model and compares the performance of the three models in modeling the distribution of intangible cultural heritage to select the optimal model for further analysis. The analysis was performed using the MGWR/GWR software developed by the School of Geographical Sciences and Urban Planning at Arizona State University. Following data import, the software automatically executes bandwidth optimization, which by default employs the Golden Section Search algorithm. This iterative approach progressively narrows the solution space containing potential optimal bandwidth values. At each iteration, it compares model optimization scores and retains the solution with the lowest score until convergence identifies the globally optimal bandwidth.
As shown in Table 3, the R2 of the MGWR model is 0.811, which is higher than that of the other two models. Compared with the OLS and GWR models, the R² of the MGWR model has increased by 44.7% and 5.3%, respectively. Moreover, the AICc value of the MGWR model is 603.779, which is lower than the GWR model’s 671.674 and the OLS model’s 768.586. The log-likelihood value of the MGWR model is −215.422, the largest among the three models. Furthermore, MGWR reduces as much noise and bias in the regression coefficient as possible by allowing the existence of multiple action scales, thus enhancing its robustness34. Therefore, the MGWR model has a better fit than the OLS and GWR models, and this study selects the MGWR model for further analysis.
In examining the spatial differentiation characteristics of each independent variable, only those variables that pass the significance test are selected for analysis. Figure 6 presents the spatial differentiation pattern of the key factors that significantly influence the spatial distribution of intangible cultural heritage (ICH) in China.

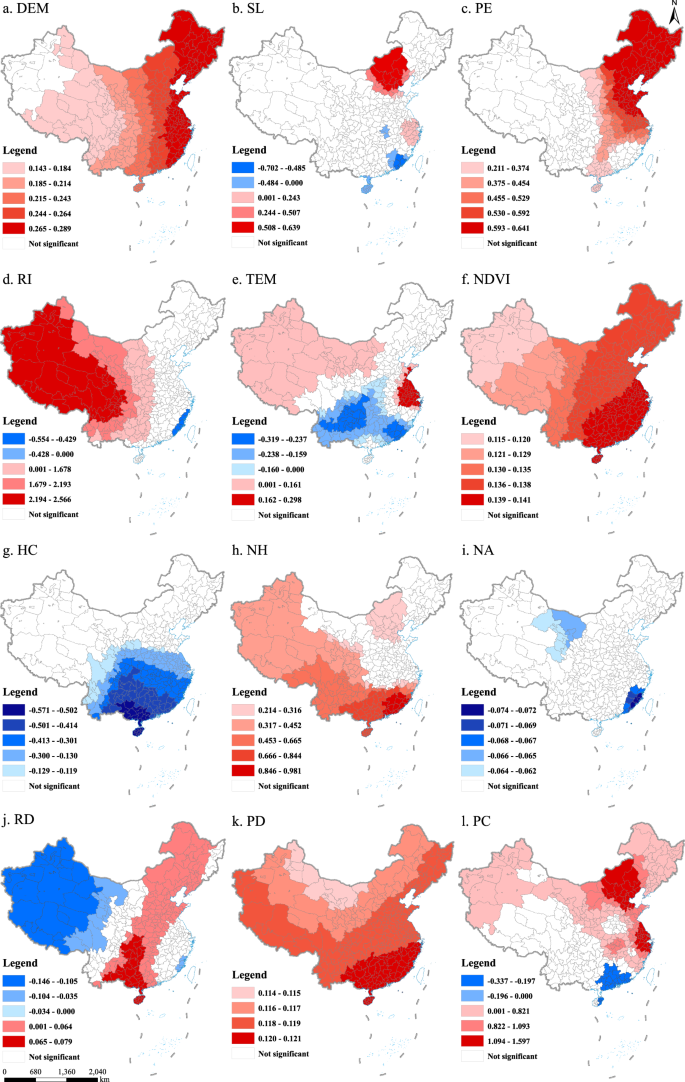
a The coefficient distribution of elevation. b The coefficient distribution of slope. c The coefficient distribution of the number of peaks. d The coefficient distribution of river network density. e The coefficient distribution of annual average temperature. f The coefficient distribution of NDVI. g The coefficient distribution of the number of historic and cultural villages (towns). h The coefficient distribution of non Han proportion. I The coefficient distribution of the number of A-level tourist attractions. j The coefficient distribution of road network density. k The coefficient distribution of population density. l The coefficient distribution of per capita regional GDP.
Elevation (DEM) exhibits a significant positive influence on the spatial distribution of intangible cultural heritage (ICH) in China (Fig. 6a), with the impact coefficient displaying a clear linear increase from west to east. Higher elevations are often associated with relatively isolated geographical environments, which foster the development of unique regional cultures, distinguishing them from those found in plains35. Additionally, these distinct geographical settings contribute to the preservation and transmission of traditional cultural practices and ethnic customs, reinforcing the cultural richness of these regions.
The analysis results indicate that slope (SL) is another significant topographic factor influencing the spatial distribution of intangible cultural heritage (ICH) in China. As shown in Fig. 6b, the coefficient range of slope varies from −0.702 to 0.639, highlighting its highly region-specific impact. In northern China, particularly in Hebei and Inner Mongolia, slope exhibits a positive influence on ICH distribution. This suggests that moderate topographic conditions may create favorable environments for human settlement, cultural exchange, and heritage preservation. Conversely, in the border region between Guangdong and Fujian, slope has a significantly negative effect on ICH distribution. This is likely due to the presence of steep slopes, which restrict agricultural development and human settlement, thereby hindering the transmission and evolution of ICH.
The number of peaks (PE) has a significant positive influence on the spatial distribution of intangible cultural heritage (ICH), particularly in Northeast and North China (Fig. 6c). The number of peaks (PE) has a significant positive influence on the spatial distribution of intangible cultural heritage (ICH), particularly in Northeast and North China. Like elevation, peaks create relatively isolated geographical environments, which can facilitate cultural differentiation and heritage preservation. The Northeast and North China regions, characterized by flat terrain and fewer peaks, provide less favorable conditions for the formation and preservation of ICH compared to mountainous areas. As a result, the presence of peaks in these regions has a more pronounced positive impact on ICH distribution.
River density (RI) reflects the distribution and abundance of water resources in a region and plays a crucial role in shaping the spatial distribution of intangible cultural heritage (ICH)24. The analysis results indicate that the coefficient value of river density ranges from −0.554 to 2.566, demonstrating significant spatial variations in its influence (Fig. 6d). In arid and semi-arid regions, particularly in the northwestern part of China, river density has a strong positive impact on ICH distribution. This underscores the critical role of water resources in the formation and transmission of ICH in water-scarce areas. Conversely, in the coastal regions of Fujian and Zhejiang in the southeast, where the river network is dense, river density exhibits a significant negative effect on ICH distribution. The high density of waterways in these areas increases the risk of frequent flooding, which can hinder the preservation and continuity of ICH.
Annual average temperature (TEM) is a key climatic factor that influences human life and production activities, thereby shaping the formation and distribution of intangible cultural heritage (ICH). The analysis results show (Fig. 6e) indicate that the coefficient ranges from −0.319 to 0.298, demonstrating significant spatial variations in its impact.
The Normalized Difference Vegetation Index (NDVI) is the most accurate indicator of vegetation dynamics25 and is closely linked to the ecological environment and agricultural production. As shown in Fig. 6f, NDVI significantly influences the spatial distribution of intangible cultural heritage (ICH) at a national scale, with a consistently positive effect across China. The coefficient ranges from 0.115 to 0.141, indicating relatively small regional variations in its impact. In the eastern and southern regions of China, such as the Northeast Plain, North China Plain, and the middle and lower reaches of the Yangtze River, NDVI has a notable positive effect on ICH distribution. These areas, characterized by fertile land and abundant vegetation, have fostered the development of distinct agricultural cultures, folk arts, and traditional handicrafts. In arid and semi-arid regions, where NDVI values are lower, its influence on ICH distribution is weaker. This suggests that vegetation conditions play a crucial role in the formation and transmission of ICH, particularly in regions with favorable ecological environments.
Historical and cultural villages (towns) (HC) serve as important carriers of intangible cultural heritage (ICH) and play a crucial role in its transmission and protection. However, the analysis results (Fig. 6g) indicate that HC primarily exerts a negative influence on the spatial distribution of ICH in southern China, forming a relatively regular linear pattern. The coefficient ranges from −0.571 to −0.119, reflecting regional variations in this impact. Notably, the negative effect of HC on ICH distribution is most pronounced in southern China, particularly in the Guangdong-Guangxi region and Hainan Province. This suggests that specific socioeconomic, environmental, or policy-related factors may influence the relationship between historical settlements and ICH distribution in these areas.
Ethnicity is a key determinant of intangible cultural heritage (ICH)36. Consequently, the proportion of non-Han ethnic groups (NH) plays a crucial role in shaping the diversity and richness of ICH. The analysis results (Fig. 6h) indicate that the impact coefficient ranges from 0.214 to 0.981, demonstrating significant spatial variations in its influence. In regions with a high proportion of non-Han ethnic groups—such as western and southern China, as well as parts of northern Hebei and Inner Mongolia—NH exhibits a strong positive effect on ICH distribution. These areas serve as primary settlements for multiple ethnic groups, characterized by distinct languages, scripts, religions, and folk customs. This cultural diversity has fostered the development of rich and varied forms of ICH, including ethnic music, dance, handicrafts, and festivals.
The number of A-level scenic spots (NA) serves as an indicator of the development level of regional tourism and plays a crucial role in the inheritance and dissemination of intangible cultural heritage (ICH). The analysis results (Fig. 6i) indicate that while NA has a negative impact in certain areas, the impact coefficient ranges from −0.074 to −0.062, suggesting minimal spatial variation in its overall influence on ICH distribution. The southeastern coastal region, particularly Fujian Province, experiences the strongest negative impact of NA on ICH distribution. These areas are rich in tourism resources and possess well-developed tourism industries, providing a broad platform for ICH inheritance and dissemination. However, they may also face challenges related to the excessive commercialization of ICH, potentially leading to destructive development that compromises its authenticity and sustainability.
Road network density (RD) is a key indicator of the development level of regional transportation infrastructure. As transportation serves as a crucial channel for the dissemination of intangible cultural heritage (ICH), well-developed road networks can facilitate the formation and transmission of ICH23. The results shown in Fig. 6j indicate that the impact coefficient of road network density ranges from −0.146 to 0.079, revealing certain spatial differences. In the western regions of China and parts of the southeastern coastal areas, RD exerts a significant negative impact on ICH distribution. Conversely, in areas along the southwest-northeast axis, RD has a positive effect on ICH distribution, suggesting that improved transportation accessibility in these regions may enhance the spread and preservation of cultural heritage.
Population density (PD) reflects the distribution and concentration of the population within a region. The analysis results (Fig. 6k) indicate that the impact coefficient ranges from 0.114 to 0.121, suggesting minimal regional variation in its effect on the spatial distribution of intangible cultural heritage (ICH). A significant positive correlation exists between population density and ICH distribution, with its influence increasing from north to south. In densely populated areas, frequent cultural interactions and exchanges facilitate the inheritance and development of ICH. In sparsely populated regions, the influence of population density on ICH is relatively weaker, indicating that population concentration plays a crucial role in fostering cultural continuity and transmission.
Per capita regional GDP (PC) serves as a key indicator of regional economic development levels. The analysis results (Fig. 6l) indicate that the impact coefficient ranges from −0.337 to 1.597, demonstrating significant spatial variations in its influence on the distribution of intangible cultural heritage (ICH). In the Pearl River Delta region, per capita GDP has a significant negative impact on ICH distribution. Conversely, in eastern and northwestern China, particularly in the Yangtze River Delta region and the border area between Hebei and Inner Mongolia, per capita GDP exerts a strong positive influence on ICH distribution.
Scale effects of influencing factors on intangible cultural heritage
This study further conducted a scale analysis to examine the influence effects of various factors on the spatial distribution of intangible cultural heritage (ICH) in China. Figure 7 presents a bandwidth comparison between the Multiscale Geographically Weighted Regression (MGWR) model and the Geographically Weighted Regression (GWR) model. The blue bar charts represent the optimal bandwidths for each independent variable as determined by the MGWR model. The blue solid line indicates the average bandwidth of the 12 independent variables in the MGWR model. The blue dashed line represents the uniform bandwidth obtained from the GWR model. The orange area illustrates the standard deviations of the parameter estimates. In the GWR model, the average bandwidth is 143 cities, whereas in the MGWR model, the average bandwidth is 192 cities—a significant difference. This discrepancy suggests that the GWR and MGWR models yield distinct interpretations of variable influences, highlighting the greater flexibility and accuracy of the MGWR model in capturing the spatial heterogeneity of influencing factors on ICH distribution.

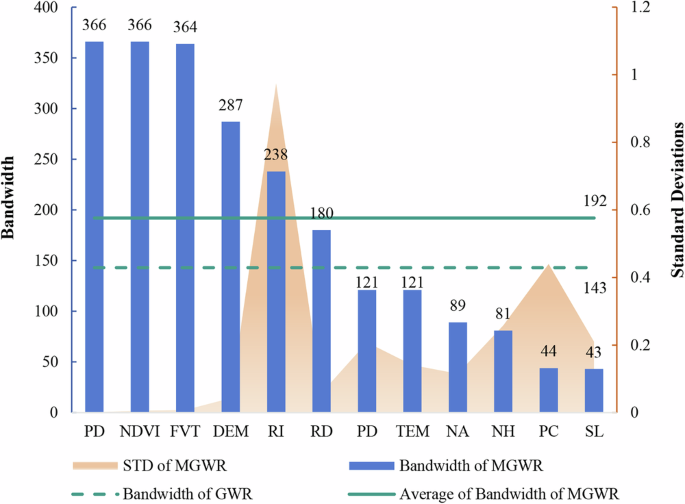
Optimal bandwidths generated by MGWR and GWR and standard deviations of parameter estimates of MGWR.
In the Multiscale Geographically Weighted Regression (MGWR) model, each variable is associated with a different bandwidth, indicating that the scale of influence varies across factors. Among the significant independent variables, the bandwidths, ranked from largest to smallest, are as follows: NDVI, PD, HC, DEM, RI, RD, TEM, PE, NA, NH, PC, and SL.
-
The optimal bandwidths for NDVI (366), PD (366), and HC (364) are close to the total sample size (367), suggesting that these variables function as global factors with minimal spatial heterogeneity.
-
In contrast, SL (43), PC (44), NH (81), and NA (89) have relatively small bandwidths, each comprising less than one-fourth of the sample size. Their parameter estimates exhibit substantial spatial variation, indicating that these factors influence the distribution of intangible cultural heritage (ICH) only at the local scale.
-
The remaining variables have optimal bandwidths ranging from 100 to 300, classifying them as medium-scale factors that affect ICH distribution within specific spatial extents.
The Geographically Weighted Regression (GWR) model struggles to capture such scale-dependent variations, as it applies a uniform bandwidth to all variables. Consequently, the MGWR model demonstrates a significant advantage in analyzing the spatial non-stationarity of influencing factors. By accommodating different spatial scales, MGWR provides a more nuanced and accurate interpretation of the mechanisms shaping ICH distribution across China.
link