


By comparing the performance of the three Bayesian models on the dataset, the results indicate that HBM is the most suitable for analyzing the effects of natural and social drivers. This approach helps to reveal the true effectiveness and mechanisms of these drivers, and provides a solid basis for developing targeted cultural heritage protection and development strategies.
The spatial distribution pattern of cultural heritage is shaped by the interaction of multiple natural and social drivers. This characteristic requires that the model can effectively deal with uncertainty in the data environment with complex correlations and noise, thereby improving the predictive accuracy and the precision of the driver analysis52. Comparing the three Bayesian models, we find that the BMA outperforms the SLR in cross-validation against the test dataset, while the SLR performs better in its ability to fit the training dataset. However, the overall performance of the two models is not as expected. This result supports the conclusion that the spatial distribution of cultural heritage and its drivers are not strictly linear, but have complex and multidimensional non-linear relationships. The HBM shows superior performance in model fitting and cross-validation, mainly due to its advantages in dealing with the complexity of diverse cultural heritage data at different hierarchical levels. By introducing a hierarchical framework consisting of hyperprior and prior, which allows partial pooling to effectively reduce the dimensionality of the parameters, it can robustly quantify the uncertainty at each level53. The structure is shown in Fig. 6.
$$P({\alpha }_{i}) \sim {\mathcal{N}}(0,{\sigma }_{{\alpha }_{i}}^{2})$$
(20)
$$P({\beta }_{i,k}|{\mu }_{{\beta }_{k}},{\tau }_{{\beta }_{k}}^{2}) \sim {\mathscr{N}}({\mu }_{{\beta }_{k}},{\tau }_{{\beta }_{k}}^{2})$$
(21)
$${y}_{i,\,j}={\alpha }_{i}+\mathop{\sum }\limits_{k=1}^{6}{\beta }_{i,k}{X}_{k,j}+{\epsilon }_{i,j}$$
(22)
$$P({y}_{i,j}|{\alpha }_{i},{\beta }_{i,1},{\beta }_{i,2},\ldots ,{\beta }_{i,6},{\sigma }^{2})=\mathop{\prod }\limits_{i=1}^{5}\mathop{\prod }\limits_{j=1}^{{J}_{i}}N({y}_{i,j}|{\alpha }_{i}+\mathop{\sum }\limits_{k=1}^{6}{\beta }_{i,k}{X}_{k,j},{\sigma }^{2})$$
(23)
$$\begin{array}{l}P({\alpha }_{i},{\beta }_{i,1},\ldots ,{\beta }_{i,6},{\sigma }^{2}|{y}_{i,j},{X}_{k,j})\propto \mathop{\prod }\limits_{i=1}^{5}\mathop{\prod }\limits_{j=1}^{{J}_{i}}{\mathscr{N}}({y}_{i,j}|{\alpha }_{i}+\mathop{\sum }\limits_{k=1}^{6}{\beta }_{i,k}{X}_{k,j},{\sigma }^{2})\cdot \\ \mathop{\prod }\limits_{i=1}^{5}\mathop{\prod }\limits_{k=1}^{6}{\mathscr{N}}({\beta }_{i,k}|{\mu }_{{\beta }_{k}},{\tau }_{{\beta }_{k}}^{2})\cdot P({\sigma }^{2})\end{array}\,$$
(24)

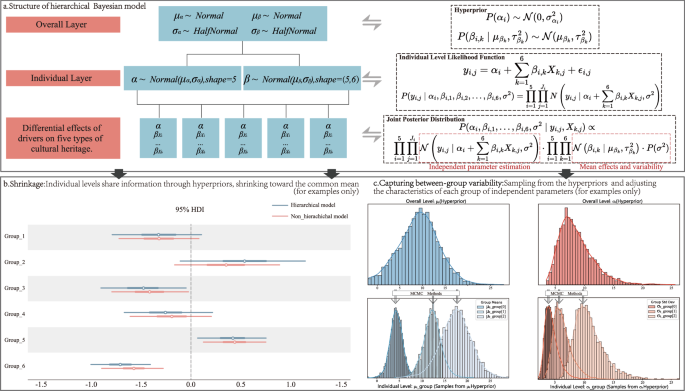
The figure illustrates in detail the hierarchical structure of the HBM and its core mathematical formulas, including the hyperprior, the individual level likelihood function and the joint posterior distribution. In addition, the figure illustrates the advantages of the HBM in dealing with differences between heritage types with two visual examples. a Structure of the hierarchical Bayesian model: The panel shows the HBM’s overall level, individual level and the differential effects of the drivers, reflecting the model’s independent sampling and shrinkage properties during parameter estimation. b Shrinkage: The panel shows the shrinkage effect of the HBM for parameter estimation in the form of a picture example. The red (R246, G152, B145) solid line indicates the parameter estimation of the hierarchical model, whose center circle represents the mean point. The blue (R117, G153, B174) solid line indicates the parameter estimation of the non-hierarchical model, whose center circle represents the mean point. As can be seen from the panel, the parameters in the hierarchical model have a narrower range of intervals and by a tendency to converge towards the center. c Capturing between-group variability: The panel indicates how the mean and standard deviation of each parameter are sampled. The first row of panels represents the overall parameter estimates. The second row of panels represents the process by which HBM samples from the overall parameters using the Markov Chain Monte Carlo (MCMC) method to obtain individual level parameter estimates. The three blue regions indicate the mean estimates of the three parameters from different individual levels. The three red regions represent the standard deviation estimates of the three parameters.
The hierarchical Bayesian model has two distinctive properties: shrinkage and capturing between-group variability. At the individual level, groups with smaller sample sizes are more likely to yield extreme values. Hyperpriors are introduced to reflect information about the group-level distribution at the overall level. Estimates from groups with smaller sample sizes, which are prone to mis-estimation, are shrunk toward reasonable intervals based on the shared information from other groups54. In other words, statistically similar groups will rely on the hyperpriors to effectively transmit this similarity to other groups. This process strengthens the common estimate and causes individual-level estimates to shrink towards the common mean. The shrinkage effect helps to reduce the variance and degrees of freedom of individual-level parameter estimates, especially when data are scarce or sample sizes are small, thereby effectively avoiding overfitting and increasing the stability of parameter estimates55. Despite the structural constraints at the overall level, analysis of the individual-level likelihood function shows that the mean and standard deviation of βi,k for each heritage type are independently extracted from the hyperpriors by the MCMC methods56. The combination of independent parameter estimates and common features in the joint posterior distribution implies that the regression coefficients for the five cultural heritage types can be adjusted to their respective datasets. These regression coefficients reflect the differential roles of the drivers. In summary, the model’s hyperpriors provide a flexible parameter space for individual-level parameter estimation. They also allow groups to sample their parameters differentially, thereby capturing the between-group variability while preserving some correlation.
The raw heritage density data for Lushan County show two small peaks and a significant skewness. This asymmetric distribution retains some irregularities even after the Box-Cox transformation, which does not completely eliminate the characteristics that deviate from a normal distribution. In this case, the normality assumption of the Bayesian model tends to smooth out some local fluctuations57, resulting in minor discrepancies between the predicted values in the trough region around 1.0 and the observed data. In fact, heritage density is influenced by many historical and practical elements, and the inherent randomness makes it difficult for the raw data to achieve normality even after transformation, thereby limiting the predictive accuracy of the HBM. Nevertheless, the overall good fit indicates that the HBM still has clear advantages in dealing with complex data structures and multi-level relationships. It is particularly effective in capturing the influence of social and natural drivers, while effectively identifying potential heterogeneity between drivers of different heritage types.
Different regions have diverse natural environment characteristics, social and human dynamics, and protection policies. These differences may easily lead to significant variations in the mechanisms of drivers on the spatial distribution patterns of different types of cultural heritage. The HBM effectively captures the general characteristics of the drivers affecting the spatial distribution at the overall level, while taking into account the data structure of five groups at the individual level. This approach eliminates the need to independently estimate all parameters for each heritage type, thereby helping mitigate the adverse effects of overparameterization on model stability and predictive performance58. The hierarchical structure allows the model to adequately account for variability across multiple cultural heritage datasets at different levels. By quantifying the differences in the regression coefficients of the drivers59, it strengthens the model’s explanatory power for analyzing multiple mechanisms of action. The HBM shows a good fit with five types of cultural heritage characterized by different distribution patterns. The model also provides insights into the influence of geography, social change, economic development, and policy orientation on spatial characteristics. Moreover, the HBM’s robust predictive performance and flexibility allow it to dynamically adapt to future socio-economic and geo-environmental changes, ensuring the relevance and timeliness of the analysis results. These advantages can make it a valuable tool for interpreting changes in the cultural heritage.
The statistical information and visualization images of the distribution of cultural heritage within the corresponding areas or buffer zones are presented in Table 4 and Fig. 7. On this basis, the regression coefficients obtained from the overall level can be combined with historical data to further explore the overall role of the drivers on cultural heritage in Lushan County.

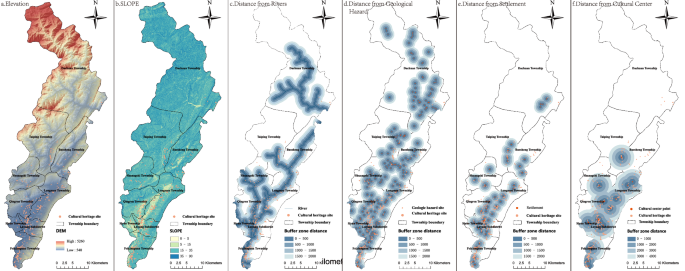
This figure visualizes the spatial relationship between cultural heritage and the six drivers. Orange (R255, G167, B127) circles indicate cultural heritage sites. Rectangular dashed boxes indicate township boundaries. a Elevation: This panel shows the correlation between cultural heritage and the topographic relief in Lushan County. The gradient from red (R227, G115, B108) to blue (R123, G157, B201) indicates the change in value of the DEM value from high (5260 m) to low (540 m). b SLOPE: This panel shows the correlation between cultural heritage and the slope change in Lushan County. SLOPE is divided into 4 levels. Yellow (R254, G254, B215) indicates a slope value of 0–5; green (R205, G235, B179) indicates a slope value of 5–15; blue-green (R91, G191, B192) indicates a slope value of 15–35; and blue (R30, G128, B184) indicates a slope value of 35–90. c Distance from Rivers: This panel shows the correlation between cultural heritage and the rivers. The blue (R46, G100, B140) line indicates rivers. The buffer is divided into 4 levels, with a gradient from dark blue (R85, G127, B161) to light blue (R211, G229, B232) ranging from low to high. d Distance from Geological Hazard: This panel shows the correlation between cultural heritage and the geologic disaster sites. The orange (R255, G85, B0) crosses indicate geologic disaster sites. The buffer has the same graded colors, and range of intervals as the river buffer. e Distance from Settlement: This panel shows the correlation between the cultural heritage and the settlements. The orange (R255, G85, B0) squares indicate settlements. The buffer has the same graded colors, and range of intervals as the river buffer. f Distance from Cultural Center: This panel shows the correlation between the cultural heritage and the cultural center points. The orange-red (255, 85, 0) circles indicate Cultural center points, and the buffer zone is divided into four levels, with a gradient from dark blue (R85, G127, B161) to light blue (R211, G229, B232) from low to high.
Analyzed according to the types of drivers, the social drivers X5 and X6 exert the greatest influence on the spatial distribution characteristics of cultural heritage. Their regression coefficients are significantly higher in absolute value than those of the four natural drivers X1, X2, X3 and X4. These results indicate that social drivers play a more important and dominant role than natural drivers in the process of shaping the spatial distribution characteristics of cultural heritage in Lushan County. In the process of long-term historical development, cultural heritage tends to emerge in areas with frequent human activities, such as adjacent settlements and historical-cultural centers, including the central areas of Luyang Subdistrict, Feixianguan Township and Longmen Township. As the intersection of political, economic, cultural and religious activities, these areas have high cultural accumulation and conservation values. They provide historical conditions for the preservation and maintenance of the region’s cultural heritage, while also promoting the clustering of cultural heritage resources60. Although natural drivers such as topography and geological hazards also influence the distribution of cultural heritage to varying degrees, their role is comparatively less significant. This finding further illustrates the profound interaction and strong interdependence between cultural heritage and human activities, highlighting that the formation of cultural heritage is primarily driven by social and cultural processes.
The differences in the role of the above drivers are mainly due to the synergistic effects of the unique social and natural contexts. By comparing these quantitative effects with the spatial distribution of cultural heritage over different historical periods (Fig. 8), a deeper understanding of the dynamics of the drivers over time can be gained. This comparison helps reveal the complex historical, environmental, and social changes underlying them.

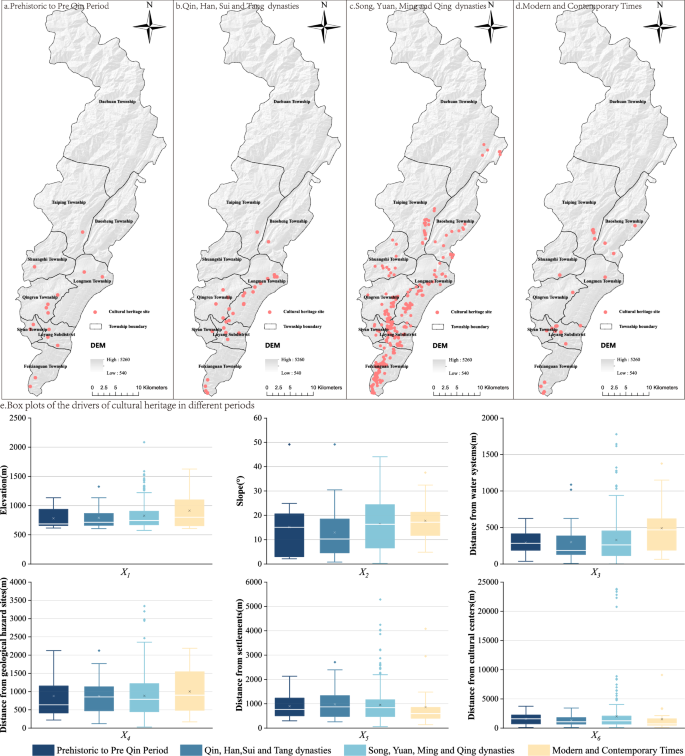
The figure illustrates the distribution of cultural heritage in Lushan County across various historical periods and the historical analysis of the six drivers. The pink (R255, G127, B127) circles represent cultural heritage points, the rectangular dashed boxes represent the administrative boundaries of each town, and the gray to white gradient map illustrates the transition from high (5260 m) to low (540 m) values of the DEM. a Prehistoric to Pre Qin Period: This panel shows the distribution of cultural heritage sites in Lushan County during the Pre-Qin Period. b Qin, Han, Sui and Tang dynasties: This panel shows the distribution of cultural heritage sites in Lushan County during the Qin, Han, Sui and Tang dynasties. c Song, Yuan, Ming and Qing dynasties: This panel shows the distribution of cultural heritage sites in Lushan County during the Song, Yuan, Ming and Qing dynasties. d Modern and Contemporary Times: This panel shows the distribution of cultural heritage sites in Lushan County during the Modern and Contemporary Times. e Box plots of the drivers of cultural heritage in different periods: The panel illustrates the dynamic impact of different drivers on the spatial distribution of cultural heritage in different historical periods. In terms of historical periods, the dark blue (R24, G66, B115) represents the Pre Qin Period; light blue (R65, G137, B161) represents the Qin, Han, Sui and Tang dynasties; green-blue (R132, G198, B222) represents the Song, Yuan, Ming and Qing dynasties; and yellow (R255, G231, B181) represents the Modern and Contemporary Times.
As shown in the figure above, most of the heritage has historically been confined to the eight towns in the center and south. Only a small amount of cultural heritage from the Song, Yuan, Ming and Qing dynasties can be found in the northern township of Dachuan. Since the establishment of the Qingyi Circuit during the Qin dynasty, the region spanning from Luyang Subdistrict to Feixianguan Township has consistently maintained its role as an economic and cultural center. Historically, the development of settlements and cultural activities were primarily concentrated in this area, and most cultural heritage sites arising from human activities also emerged here. According to the statistical data of the drivers, the cultural heritage of each historical period is mainly concentrated in the following ranges: 654–1000 m in elevation, 3–20° in slope, 200–600 m from water systems, 415–1500 m from geological hazard sites, 400–1100 m from settlements, and 495–1600 m from cultural centers. A horizontal comparison of the site selection characteristics over the four periods reveals an overall upward trend in the four natural drivers. This suggests that with the development of society, especially the improvement of technology and scientific cognition, humans have become less dependent on the natural environment and more focused on safety when selecting cultural heritage sites. Conversely, the two social drivers show an overall downward trend, reflecting the gradually increasing role of settlements and cultural centers in the spatial distribution of cultural heritage, and cultural heritage becoming more dependent on the social environment. Undoubtedly, this finding further supports the importance of social drivers.
Subsequently, a separate analysis of each driver at the overall level reveals that an increase in X1 is accompanied by a decrease in the density of cultural heritage. In Lushan County, the lowest altitude is 540 m above sea level, with 80.83% of the heritage sites located between 540 m and 1000 m, and there are no cultural relics above 3500 m. This characteristic occurs because altitude directly influences climatic conditions, leading to differences in agricultural production, human accessibility and resource availability. Archeological evidence from the Khatlon region of southern Tajikistan may confirm the emergence of ancient structures such as settlements, temples and fortresses in low-lying river-adjacent areas due to intense agricultural activity61, reflecting the commonality of human behaviors in the early agricultural era. Low-altitude areas generally have high-quality soils and water-heat conditions that provide a favorable environment for crop growth and may facilitate human settlement, trade and cultural activities62. Frequent human activities, such as construction and agricultural production, combine spiritual perception with material carriers, facilitating the production of cultural heritage. In contrast, high altitude areas are constrained by climatic conditions such as cold and uneven rainfall, which limit social functioning and agricultural production. The steep terrain and complex geological formations of these regions increase the frequency of natural disasters, which not only increase settlement risks, but also hinder the development of infrastructure and transport. Consequently, cultural exchange and interaction are limited, which hinders the creation and preservation of cultural heritage.
The results of existing studies have shown that the geological structure of steeper slopes is inherently unstable and there is a high risk of geological hazards such as mudflows and landslides. This treacherous terrain reduces regional connectivity and consequently the frequency of human activities63. Furthermore, rivers and lakes have historically been crucial to the emergence and development of human civilization. As both natural resources and geographical barriers, their spatial and temporal distribution profoundly influences the environmental characteristics of regions64. Based on the above theories, the relevant studies mainly rely on the percentage distribution of sites within multi-level buffers, thereby inferring that steep slopes and distance from water systems negatively affect the heritage density. However, both βi and βX3 are not statistically significant in the overall results of the HBM calculations. This statistical non-significance does not necessarily imply the real effect of slope and water systems65, but rather provides inconclusive evidence regarding the hypothesis of their effects66. This indicates that the HBM cannot draw conclusions regarding the negative effects of X2 and X3 on heritage density based on the heritage data from Lushan County at the overall level.
The 95% HDI for βX4 is within the positive range at the overall level, indicating that cultural heritage tends to be distributed in areas far from geological disaster sites. Lushan County is located on a branch of the Longmen Shan fault zone, an earthquake-prone region in southwest China, and is frequently affected by natural disasters such as torrential rain, landslides, and mudslides67. Through long-term life practice, Lushan’s ancestors have developed a series of effective disaster management systems, ranging from building site selection, water conservancy projects, granary management and tax exemption68. Guided by this framework of hazard avoidance, agricultural production and cultural activities are primarily concentrated in low-risk areas. Consequently, cultural heritage, which is inherently linked to human activities, is typically located far from geological disaster sites. 71.76% of the cultural heritage sites are located more than 500 meters away from geological hazard zones, underlining this pattern.
X5 shows the highest intensity of influence and a significant negative effect on heritage density, highlighting the critical role of settlements and their spatial distribution. 66.06% of the cultural heritage sites are located within the 1 km buffer zone of the settlement. This phenomenon is closely related to the fact that settlements in the agricultural era were typically built at key transport nodes, including river crossings and mountain passes, and often played the role of production and trade centers69. One of the important functions of settlements is to facilitate the exchange and dissemination of essential goods, handicrafts, and cultural practices. Their location and construction reflect the lifestyles and cultural values of ancient people and communities. As a result, settlements not only facilitate economic and commercial prosperity, but also serve as important sites of cultural expression through the convergence of people, and their environments are also endowed with unique regional cultural characteristics. In addition, settlements are complex systems influenced by multiple interacting drivers and experience periods of rise and decline in response to changing demographic, political, and cultural circumstances70. Rooted in traditional clan culture and customs, residents living within settlements over generations develop a shared collective memory as the settlement evolves, thereby establishing a regional center of cultural activity. Therefore, cultural remains such as dwellings, clan shrines, temples, and family tombs are often adjacent to the settlements and show the characteristics of an extremely dense spatial distribution around these areas.
X6 serves as an important social driver and exerts a significant negative effect on heritage density. Cultural centers tend to have rich cultural connotations and frequent commercial exchanges. These activities promote the continuation of local traditions and customs, while enriching the diversity and complexity of heritage resources through events such as temple fairs and festivals. These human activities create favorable conditions for the creation and preservation of cultural heritage60. Through the reconstruction of ancient hydroclimatic models, scholars have shown that the ancient Silk Road greatly contributed to the spatial evolution of human civilization in the process of cultural exchange and trade route change71. Similarly, genomic testing has confirmed large-scale migrations to Britain during the Middle and Late Bronze Age, which strengthened cultural ties with continental Europe and significantly influenced cultural change within Britain72. Both cases illustrate the crucial role of cross-regional cultural exchange in shaping cultural identity and contributing to the flourishing of cultural heritage. The data shows that 72.54% of the cultural heritage sites are located within the 2 km buffer zone of the cultural center. These sites are mainly located in the western part of Luyang Subdistrict, the western part of Feixianguan Township, the eastern part of Qingren Township, and the southern part of Longmen Township, all of which have long-standing historical significance. This spatial distribution pattern reflects the strong influence of the cultural center on the adjacent areas, especially in terms of cultural communication, social interaction, and resource sharing, resulting in a high density of cultural heritage in these areas.
Although the direction of influence and effect size at the individual level are limited by the hyperprior information, the HBM still preserves the differences in the regression coefficients of these drivers within different groups (Fig. 9). This finding highlights that different types of cultural heritage do not respond to the same drivers in the same way.

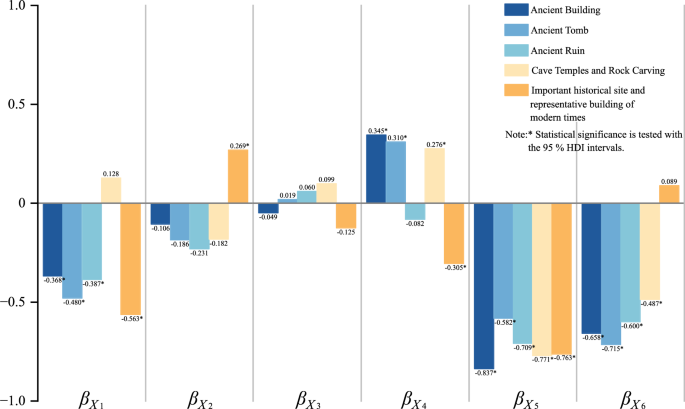
The figure displays the mean values of the regression coefficients for the six drivers at the individual level. Values marked with * have a statistically significant effect and their 95% HDI does not contain 0. Positive and negative numbers indicate positive and negative correlation respectively, and the absolute value of the numbers is a measure of the intensity of the effect. In the classification of cultural heritage types, dark blue (R32, G89, B155) represents ancient buildings; light blue (R109, G171, B213) represents ancient tombs; green-blue (R157, G205, B218) represents ancient sites; yellow (R255, G231, B181) represents cave temples and stone carvings; and orange (R255, G231, B181) represents important historical sites and representative buildings in modern times.
The regression coefficient of X1 on the density of cave temples and rock carvings does not reach statistical significance, but its positive mean value suggests a potential tendency for this heritage type to be distributed at higher altitudes. One possible explanation is that the Lushan region is strongly influenced by Taoist and Buddhist cultures. This phenomenon has led to a tendency for religious buildings and ritual sites to be constructed in elevated areas, following the process of “landscape sacralization”, where such places are revered as sacred sites73. As Buddhism and Taoism flourished in the Lushan region during the Ming and Qing dynasties, the fusion of religious and secular cultures likely facilitated the construction of cave temples and rock carvings. Therefore, many of these heritage sites are located on high mountain peaks. While this observation aligns with historical and cultural context, the lack of statistical significance in the regression model indicates that the underlying mechanisms of elevation in relation to heritage distribution are not yet fully understood. Relying solely on heritage data from Lushan County is insufficient to validate the prevalence of this special phenomenon. Future studies should incorporate larger sample sizes to increase the likelihood of finding a statistically significant result, which in turn will reveal the true effect of elevation on such heritage74.
There are 26 important historical sites and representative buildings of modern times, 22 of which are former sites and relics of the Chinese Workers’ and Peasants’ Red Army. X4 and X2 exert significant negative and significant positive effects on the density of this heritage type, respectively, and both differ from the general pattern. These results suggest that these heritage sites lack consideration of the proximity to geological disaster zones in their site selection, but tend to be located on steeper slopes. Overall, these sites are mainly located in the rugged areas of southern Taiping Township, western Luyang Subdistrict, and eastern Siyan Township, which overlap significantly with geological hazard zones. Due to their steep topography and complex geology, these mountainous areas are prone to frequent geological hazards such as mudslides, landslides, and avalanches75, rendering them unsuitable for settlement and cultural activities. However, terrain is of great importance for military deployment, reconnaissance and combat mobility, often determining the success or failure of military operations. Relatively steep slopes are advantageous for strategic military operations, so the site selection for this heritage type is primarily based on military considerations and criteria76, rather than solely on residential and cultural needs. Furthermore, X6 exerts significant negative effects on the densities of the other four heritage types while the regression coefficient on the density of this category is not statistically significant. This further supports the conclusion that there is a lack of correlation between cultural centers and the siting of this heritage category. This may be due to military and strategic considerations dominating the siting of heritage sites, resulting in cultural centers having no significant effect.
The watershed and its rich environmental resources are indispensable for human survival. However, the 95% HDI of βX3 for each heritage type includes zero, indicating that X3 does not exert a significant effect on heritage density. A comparison of the locations of water systems and geological hazards presented in Fig. 7 shows that landslides and mudslides are common in the vicinity of the Lushan River and Qingyijiang River watersheds. In addition, the watersheds are also associated with uncertain hazards such as destructive floods caused by climate change (e.g. the Yellow River) and river network contraction due to reduced flow (e.g. the Nile River in Nubia)77. When scientific knowledge is limited, ancestors choose to live near water for survival. This tendency results in a distribution of heritage sites near water and geological hazards. With the development of water diversion, storage and irrigation technologies (e.g. well drilling, canal, and warping irrigation), ancient communities can gain access to distant water resources. This allows settlements to be established away from geological hazards and major rivers78, thereby strengthening the resilience of their social-ecological systems. As a result, the influence of water systems on cultural heritage gradually diminishes over time, leading to the emergence of settlement patterns further from water sources and geological hazards. This transition explains why the absolute value of βX3 is close to zero and non-significant for the densities of all heritage types. It reflects the relatively small influence of water systems on the spatial distribution of cultural heritage in Lushan County. Existing research suggests that the water systems may have played an important role in early human settlement decisions. However, the modelling results suggest that the threat of natural disasters may have had a more significant effect on the distribution of cultural heritage in the historical context of technological advancement and evolving lifestyles.
X4 exerts a significant positive effect on heritage density in the general pattern. However, the 95% HDI of its regression coefficient on ancient ruins includes 0, with a mean value of -0.09, indicating that the density of ancient ruins is not significantly affected by geological hazards. From the perspective of historical background and human cognitive development, the ancient ruins in Lushan County are mainly pre-Neolithic human or paleontological sites. The ancestors do not have the level of modern scientific understanding of natural phenomena. They lack a systematic understanding of the causes of geological hazards and their associated risks, and may even regard natural disasters such as floods, earthquakes and landslides as the will of the gods, giving them moral weight79. At the Sanxingdui site (4.4–2.9 ka B.P.), 150 km from Lushan County, burial pits containing ash and charcoal fragments have been excavated, which are thought to be sacrificial pits used by the ancient Shu people for sacrificial rituals to pray for God’s forgiveness80. In this context, the ancestors prioritize natural resources such as water, food and land, which are directly related to their living conditions, and fail to avoid potentially high-risk areas for geological hazards. However, with the breakthrough of scientific cognition and technical limitations, people gradually and consciously begin to avoid the hazards posed by disasters as social memories of such events are generated. Subsequently, the spatial management models and disaster management strategies of settling in safe areas will be implemented81, and the distribution pattern of cultural heritage away from geological hazards will emerge. Therefore, although X4 exerts significant effects on the densities of the remaining four cultural heritage types, it does not exert a statistically significant effect on the density of ancient ruins.
The quantitative results of the HBM can be an important source of inspiration for the construction of scientific strategies for the protection, development and inheritance of cultural heritage resources. The quantification system is constructed through the regression coefficients and raster images of the drivers to generate the prediction map of cultural heritage suitability82. After identifying the spatial differentiation characteristics of cultural heritage suitability, development zones are delineated according to the sustainability objectives. Additionally, nine indicators such as elevation, normalized difference vegetation index (NDVI), slope and land use type, are selected to generate the geologic hazard susceptibility assessment map based on the information quantity model83. Combined with the overall characteristics of geological hazards, cultural heritage protection zones are delineated to provide reference for disaster prevention strategies (Fig. 10).

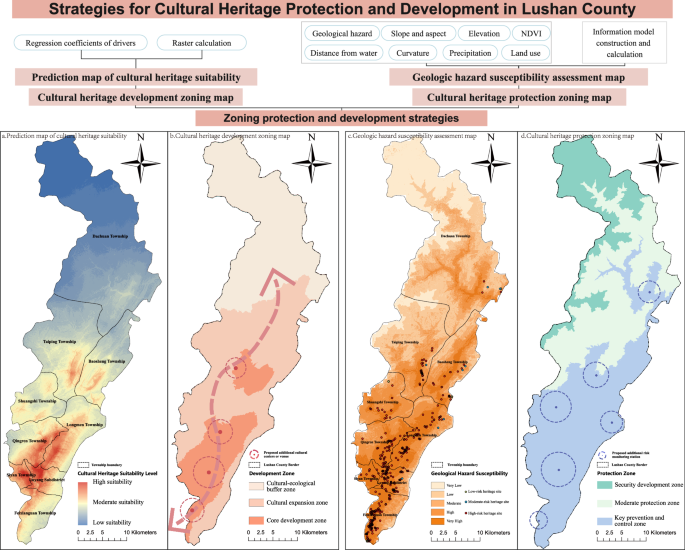
The figure illustrates the process of constructing the four geo-featured panels and highlights the hierarchical planning for cultural heritage protection and development in Lushan County. a Prediction map of cultural heritage suitability: This panel shows the suitability ratings of cultural heritage within Lushan County. The rectangular dashed boxes indicate the administrative boundaries of the townships, and the gradient from red (R222, G88, B82) to blue (R106, G145, B196) indicates the change in suitability rating from high to low. b Cultural heritage development zoning map: The panel shows the distribution of cultural heritage development areas within Lushan County. The pink (R206, G78, B104) circles represent proposed additional cultural centers and venues, while the rectangular dashed boxes indicate the administrative boundaries of Lushan County. The light (R253, G233, B219), medium (R252, G204, B183) and dark (R253, G153, B120) colors indicate cultural-ecological buffer zone, cultural expansion zone and core development zone respectively. c Geologic hazard susceptibility assessment map: The panel shows the evaluation of the susceptibility of cultural heritage geological hazards in the territory of Lushan County. The rectangular dashed boxes indicate the administrative boundaries of each township. Red (R255, G0, B0) circles represent high-risk heritage sites, blue (R0, G197, B255) circles represent medium-risk heritage sites, and green (R209, G255, B115) circles represent low-risk heritage sites. The five gradient colors from yellow (R255, G236, B207) to orange (R242, G126, B17) represent the change of the susceptibility level from very low to very high in the division of the area. d Cultural heritage protection zoning map: The panel shows the distribution of cultural heritage protected areas within Lushan County. The purple (R101, G111, B226) circles represent the proposed additional risk detection stations, while the rectangular dashed boxes indicate the administrative boundaries of Lushan County. The green color (R139, G209, B195) represents the security development zone, the light green color (R231, G247, B232) represents the moderate protection zone, and the light purple color (R181, G205, B236) represents the key prevention and control zone.
The strong correlation between cultural heritage and human behavior in Lushan County indicates that sustainable population growth and mobility form the basis for cultural heritage development, while cultural exchanges and diverse interactions drive heritage transmission and innovation. Preserving the original appearance of settlements and cultural centers in the core development zone during urban renewal is essential. Meanwhile, establishing four additional cultural venues, implementing talent attraction policies and promoting cultural industries can provide the necessary support for the sustainable development of cultural heritage. The cultural expansion zone is proposed as a functional complementary zone aimed at developing moderate cultural industries and ecotourism, while also accommodating the spillover demand for cultural industries from the core zone. The cultural-ecological buffer zone has the potential for ecological protection and cultural dissemination, and can carry out low-intensity science education and cultural activities. In addition, for the ancient buildings, important historical sites and representative buildings of modern times that are highly dependent on the natural environment, it is recommended that the surrounding areas be included in the key prevention and control zone. This zone should prioritize ecological restoration and the establishment of additional risk monitoring stations, which may effectively strengthen the resilience of the cultural heritage to natural disasters, thereby ensuring its long-term conservation and legacy. The moderate protection zone should be based on dynamic monitoring and regular heritage risk assessment to gradually improve the safety and sustainability of the cultural heritage. The security development zone has lower disaster risks and may moderately develop cultural heritage resources to support cultural tourism and education. Overall, social resources should be integrated to build a network of cultural heritage restoration, promotion and digital preservation, with the government as the main body and public participation. Moreover, social capital should be encouraged to invest in cultural tourism development and creative industries to promote Han and Red Army cultures, thereby positioning cultural heritage as a bond for regional resource sharing.
The cultural heritage of Lushan County was selected for this investigation. After integrating and processing the data from multiple sources, three Bayesian models were constructed to evaluate their effectiveness in studying the drivers of the spatial distribution of cultural heritage. Subsequently, the optimal model HBM was screened to obtain the means and 95% HDIs of the regression coefficients of the drivers. Finally, the mechanisms of the six drivers of the spatial distribution of cultural heritage were analyzed. The main conclusions are as follows:
(1) The hierarchical structure of the HBM guides the parameter estimation at the individual level by using global information from the overall level. This structure allows the model to adequately capture the differences in the regression coefficients of the drivers on the spatial distribution characteristics of different heritage types at the individual level. Moreover, the model shows a stronger explanatory power for the observed values of heritage density and a robust generalization performance. This capability supports dynamic adjustments in response to changes in environmental characteristics, thereby improving the timeliness and accuracy of the analysis results.
(2) The spatial distribution of cultural heritage in Lushan County shows the general characteristic of “south-dense, north-sparse”. Specifically, Luyang Subdistrict serves as the high-density cultural heritage center. The distribution extends south to Feixianguan Township and Taiping Township in the center, forming a major cultural heritage area in the central and southern regions. The northern area, on the other hand, has a distinctly sparse distribution of cultural heritage. This distribution pattern is closely related to the natural geographical conditions and the historical-cultural background of the region. At the overall level, the result shows that X1, X5 and X6 have significant negative effects on heritage density and X4 has a significant positive effect, while the regression coefficients of X2 and X3 are not statistically significant.
(3) Social drivers X5 and X6 exert the strongest influence on the spatial distribution of cultural heritage. Their regression coefficients are significantly higher in absolute value than those of the natural drivers X1, X2, X3 and X4. Moreover, combined with historical analysis, it is clear that over time cultural heritage has become increasingly independent of the natural environment and more dependent on the social environment. This conclusion further shows a strong dependence between the formation and evolution of cultural heritage and human activities. The results highlight the central role of social drivers in heritage conservation and inheritance. This finding provides an empirical basis for spatial planning and heritage protection, while offering a new perspective for understanding the influence mechanism of human activities on cultural heritage.
(4) Under the constraints of the overall law, the individual level reveals the differential effects of the drivers: X1 has no significant effect on the density of cave temples and rock carvings. X2 and X4 have a significant positive and negative effect on the density of important historical sites and representative buildings of modern times, respectively, while X6 has no significant effect on the density of this heritage type. The role of X3 on cultural heritage gradually weakens with the historical process, with no significant effect on the density of any heritage type. X4 has no significant effect on the density of ancient ruins.
Based on the dynamic updating capabilities of Bayesian models, the HBM can instantly identify risk factors affecting cultural heritage in response to climate change, land use change and adjustments to heritage protection strategies. However, incomplete integration and analysis of archeological and historical data, coupled with challenges in basic data collection, limit most available information to qualitative descriptions of heritage concepts and mechanisms. Consequently, the rigorous quantitative analyses required to build Bayesian models remain relatively limited. Only a few drivers that are less dependent on specific historical contexts can be selected for quantification to ensure that errors caused by changes in historical data are reduced. This limitation restricts the model’s ability to comprehensively reveal the evolution of cultural heritage across temporal and spatial dimensions. Furthermore, the absence of significant effects of certain drivers (e.g. water systems) on the density of certain heritage types suggests that complex mechanisms may underlie the spatial distribution of cultural heritage that are not yet fully understood. The parameters obtained based on the sample size of Lushan County may not be applicable to other study areas or scales. As quantitative analyses in history, archeology, anthropology and paleoclimate continue to advance, future research will provide deeper insights into the dynamic role of drivers across spatial and temporal dimensions using Bayesian modelling. Meanwhile, increasing the sample size is expected to enhance the likelihood of obtaining statistically significant results, thereby providing a clearer understanding of the true effect of the drivers. In the context of global climate change threatening heritage conservation, this method can provide a valuable reference for the protection and development of cultural heritage to meet the international community’s demand for sustainable heritage management.
link