Evaluation of low-carbon cementitious composites in marine environment for coastal protection and artificial reef substrate
Mineralogy of different binder systems under seawater exposure
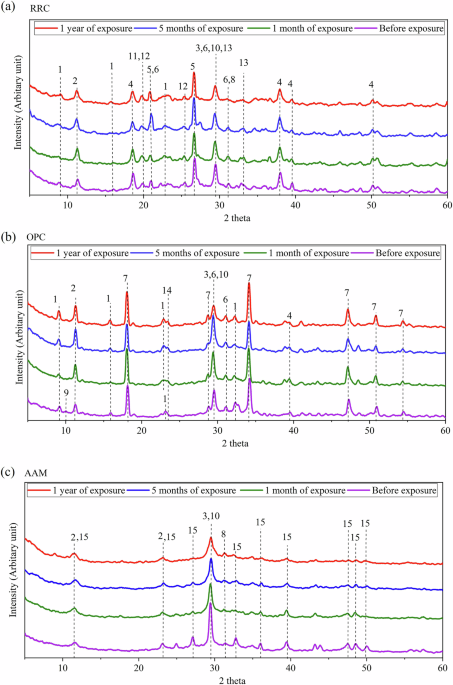
Figure 1 shows the mineral formation in different paste samples before exposure and after 1 month, 5 months, and 1 year of natural seawater exposure. Portlandite added as a raw material in the RRC mix reacted with Al and Si from calcined clay and was completely consumed, with no traces remaining even after 28 days of laboratory curing (Fig. 1a). As per the previous study, pozzolanic reactivity between calcined clay and lime should form C-S-H, C2ASH8 (stratlingite), and tetracalcium aluminate hydrates (C4AH13)37. Due to the incorporation of seawater, hydrocalumite formation was observed at 11.4°(2 theta), resulting from the binding of Cl– by C4AH13 (Fig. 1a)38,39. The peak at 29° (2theta) can be because of several phases, including C-S-H 40,41, calcite, gypsum, and katoite. Among the other crystalline formations, quartz was evident in RRC mixes due to using medium-grade kaolin clay22,42. Mg(OH)2 was present in hydrated lime used to produce RRC (Table 1). Consequently, brucite (Mg(OH)2) was observed in these clay mixes from the early hydration period (Fig. 1). Throughout the exposure period, the XRD analysis revealed no significant changes in the RRC sample.

Mineralogical details in (a) RRC, (b) OPC and (c) AAM binder systems before exposure and after 1 month, 5 months, and 1 year of natural seawater exposure. Here, 1: Ettringite-PDF-96-901-7147; 2: Hydrocalumite-PDF-96-900-9354; 3: Calcium silicate hydrate40,41; 4: Brucite-PDF-96-101-0485; 5: Quartz-PDF-96-900-5020; 6: Gypsum-PDF-96-901-3167; 7: Portlandite-PDF-96-100-1769; 8: Akermanite-PDF-96-900-6451; 9: Monosulfate40; 10: Calcite-PDF-96-210-0993; 11: Montmorillonite-PDF-96-901-0958; 12: Grossite-PDF-96-350-0015; 13: Katoite-PDF-96-900-2710); 14: Thaumasite-PDF-96-901-0880; 15: Tetracalcium aluminate hydrate (C4AH13)41.
In OPC paste (Fig. 1b), calcium aluminate monosulfate formation was observed before exposure to natural seawater. The hydration of C3A in the presence of gypsum (CaSO₄·2H₂O) leads to the formation of ettringite (Ca₆Al₂(SO₄)₃(OH)₁₂·26H₂O)43. Over time, as the gypsum is consumed, the ettringite gradually transforms into monosulfate (Ca₄Al₂O₆(SO₄)·12H₂O)43. Due to the SO42− ion abundance in natural seawater, this mineral eventually transformed into ettringite at later stages44. OPC hydration continuously produced portlandite44. The SO42− ions from seawater also reacted with Ca2+ ions released from this portlandite and produced gypsum. Moreover, soluble carbonates in seawater gave rise to calcite and thaumasite in the OPC sample after 5 months and 1 year of exposure. Thaumasite is known to form at low temperatures32,45, and is a non-cementitious product resulting from the reaction between CaCO3, gypsum, and C–S–H32. So, while enduring a winter season during the exposure period, thaumasite was produced in the OPC sample (23.39° two-theta).
In alkali-activated materials (AAM), a sufficiently high concentration of hydroxide ions is necessary to dissolve adequate amounts of Ca, Al, and Si from slag, while metal cations are essential for charge balancing within the product phase46. The primary reaction products have been identified as C-S-H/C-A-S-H phases, calcite, and tetracalcium aluminate hydrate (C4AH13) (Fig. 1c)18,41. The peak at 29.6° for this sample was sharp before exposure, but broadened as the natural seawater exposure duration increased. The increase in amorphous C-S-H content likely contributed to the broadening of this peak. Before exposure to natural seawater, prominent peaks corresponding to C4AH13 were observed at 27.1°, 32.85°, 36°, 47.6°, 48.6°, 49.9°. However, after one year, these peaks disappeared, with only peaks at 11.6° and 23.2° remaining, suggesting the possible presence of both C₄AH₁₃ and hydrocalumite. This indicates that the abundance of chloride ions in seawater facilitated the transformation of C₄AH₁₃ into hydrocalumite18.
Pore structure of different binder systems under seawater
Figure 2a–c depicts the quantification of the cumulative porosity combining mesopores (radius 2–50 nm) and macropores ( >50 nm)47 across different samples before exposure, and after 1 month and 1 year of natural seawater exposure. Overall, the cumulative pore volume of the RRC sample remained constant over the exposure duration, around 0.18–0.2 ml/g, with a slight reduction after one year (Fig. 2a). The OPC sample initially exhibited a higher cumulative pore volume than RRC, totaling approximately 0.27 ml/g after 1 month of exposure (Fig. 2b), attributed to its higher water/cement ratio (Table 2). However, after 1 year, the total pore volume of OPC reduced to 0.18 ml/g, possibly due to the continuous cement hydration and ettringite formation filling out the pores. The cumulative pore volume of AAM ranged from 0.07–0.1 ml/g, which was the lowest among all the different binder systems (Fig. 2c), indicating a dense microstructure.

Changes in the pore distribution at different exposure durations to natural seawater. Cumulative intrusion of (a) RRC, b OPC, and (c) AAM sample, and differential intrusion distribution of (d) RRC, e OPC, and (f) AAM sample.
Figure 2d–f show the changes in the pore size distribution of the samples before exposure, after 1 month, and after 1 year of natural seawater exposure. Since the minimum detectable pore diameter of the MIP instrument used in this study was 5 nm, the measured pore sizes for all three cementitious systems ranged from 5 to 110 nm. As per previous literature, pore diameters ranging from 3.75–5 nm correspond to pores in compact C-S-H, 5–40 nm refer to less compact C-S-H connected to larger capillary pores, 40–100 nm include capillary pores and microcracks, and above 100 nm indicate large capillary pores and defects48. RRC depicted only one critical pore diameter, ranging from 5–40 nm49 (Fig. 2d), indicating minimal capillary pores due to the tight packing of gel and crystalline phases. Over time, the critical pore diameter increased, likely due to the crystallized phase growth from prolonged seawater exposure and leaching of ions. For OPC and AAM, two critical pore diameters were observed: one at around 5–40 nm and another at 40–100 nm (Fig. 2e, f). The medium capillary pore induced in the OPC matrix before exposure to natural seawater can be due to its higher water/binder ratio. Upon seawater exposure, the ion influx led to mineral formation in OPC (Fig. 1b, XRD analysis). This initially increased the critical diameter of the capillary pores after one month, but after 1 year, this diameter reduced (Fig. 2e). As shown in the TGA plot (Fig. S1b, Supplementary section), the hydration product formation in the OPC matrix continued to increase over time, reaching a maximum at one year. These hydration products precipitated within the capillary voids, progressively filling them and thereby reducing the critical pore diameter50. Capillary voids were also observed in AAM prior to natural seawater exposure (Fig. 2f); however, the volume of the pores in this region is much lower than that observed in the OPC system. After 1 year of exposure, the peaks in the pore size range of 10–100 nm decreased; instead, a new critical pore diameter of 5 nm emerged, indicating gel pore formation. Fig. S1c (Supplementary section) also confirms that C-S-H/C-A-S-H precipitation in the AAM system significantly increased after one year of exposure to seawater. This suggests that the initially slow hydration of AAM led to the presence of larger pores, which were progressively filled over time with gel phases such as C-S-H/C-A-S-H, thereby refining the pore structure and enhancing the microstructural integrity18.
Evolution of microstructure observed from cross-sectional analysis
MicroCT image analysis was performed to investigate microstructural changes and the distribution of large pores or air voids with diameters exceeding 60 µm in various binder systems after 1 month and 1 year of natural seawater exposure (Fig. 3). Both the grayscale and color images in Fig. 3 depict the pixel intensity variation along the cross-section (XZ plane), with the color gradient displayed at the top. The darker blue shade represents the pixels with lower light intensity, while the brighter colors on the right indicate pixels with higher light intensity (Fig. 3).

Microstructural changes visualized in (a) RRC, (b) OPC, and (c) AAM sample from the pixel intensity variation in the greyscale and color cross-sectional images. Air void distribution in (a-vii) RRC, (b-vii) OPC, (c-vii) AAM.
The RRC paste samples did not show any major crack up to 1-year exposure duration (Fig. 3a), attributed to the lack of portlandite content, and the mineral formations sequestering SO42− and Cl– during the initial hydration stage (Fig. 1a). Moreover, the color image of the RRC cross-section (Fig. 3a-iii) showed a bluish outer rim formation at the initial stage of seawater exposure (1 month). After 1 year, this blue rim expanded, and an additional greenish rim developed outside of it (Fig. 3a-iii). To investigate the reason for the bluish-colored zone, a small sample measuring around 4–5 µm on each side was taken from the peripheral region of the 25 × 25 × 25 mm3 paste sample; the microCT analysis of this sample yielded images with 9 µm resolution (Supplementary section, Fig. S2). Segmenting two cylindrical volumes (22.5 mm3) from this high-resolution 3D image revealed that the bluish area has a porous matrix with a pore volume of 0.27 mm³, while the greenish area is denser with a pore volume of 0.11 mm³ (Supplementary section, Fig. S3). Therefore, even though RRC samples did not crack after 1 year of exposure, the outer layer of these composites became more porous with time. Such an increase in porosity could be due to two mechanisms: (i) element leaching from the matrix to seawater and (ii) gel phase conversion to crystalline products, reducing molecular volume. Further microstructural analysis is necessary to confirm the variations in product formation within these rims. Additionally, microCT pore distribution analysis of the RRC sample quantified the total air void volume to be 33 mm³, which constitutes 0.55% of the total sample volume (pore diameter: 0.06–1.86 mm) (Fig. 3a-vii).
As shown in Fig. 3b, OPC paste samples showed full-depth crack formation at both exposure durations (1 month and 1 year). This cracking can be attributed to the continuous ettringite and gypsum formation over time (Fig. 1b), as ettringite can expand by absorbing water and damage the concrete microstructure6. The total air void volume of the OPC sample was lower than that of the RRC sample, measuring 15.22 mm³, which constitutes 0.24% of the total sample volume (pore diameter range: 0.06–0.82 mm) (Fig. 3b-vii). Also, as per the pore distribution analysis, the peripheral region had fewer small-diameter pores (denser blue dots at the core than the periphery).
After 1 month of exposure, the AAM paste samples exhibited extensive cracking originating from the surface (Fig. 3c-i, ii, iii), indicating them to be shrinkage cracks. Such shrinkage cracks may have formed at the early-age during sealed curing and before SW exposure. Following 1 year of exposure, the shrinkage cracks expanded and merged, completely fracturing the sample (Fig. 3c-iv, v, vi). At this point, the AAM paste sample was extremely weak and crumbled with minimal tapping. This weakness can be attributed to drying shrinkage during the initial sealed curing period (before exposure), leading to crack formation, which propagated over time51. AAM is susceptible to drying shrinkage primarily due to the lack of crystal phases like portlandite and the C-A-S-H characteristics52. The high alkali dosage (5% Na2O) likely increased slag dissolution17, resulting in dense gel precipitation with a fine pore structure, as indicated by MIP analysis (Fig. 2c). This led to high capillary pressures during drying, significantly enhancing shrinkage in this sample52. The total air void volume in AAM was the lowest among all cementitious systems, measuring 5.16 mm3, constituting 0.07% of the total sample volume (pore diameter: 0.06 ~ 1.58 mm) (Fig. 2c-vii).
Compositional variation in the peripheral region
When cementitious composites are submerged in seawater, ions begin to permeate from the outer regions. Consequently, the most significant changes occur in this area, and identifying microstructural evolution can be achieved by observing the changes in mineral composition there. To investigate this, BSE-EDS with areal mapping was initially used to analyze the elemental variations in the outer regions of different binder systems. Following this, TGA and FTIR were employed to confirm the changes in the gel and mineral phases.
As observed from the BSE image in Fig. 4a-i, the outermost region of the 1-year seawater-exposed RRC sample appeared bright. A darker layer existed on the left of this zone; it became greyish further to the left towards the core. The atomic area mapping in Fig. 4a-ii shows that the peripheral region (on the right) was rich in calcium (Ca) with no magnesium (Mg) presence (Fig. 4a-iii, iv). In contrast, the darker zone was rich in Mg and lacked Ca (Fig. 4a-iii, iv). Towards the core of the sample, the Ca levels increased again while Mg levels decreased (Fig. 4a-iii, iv). The aluminum (Al) and silicon (Si) content remained consistent across all three zones (Fig. 4a-v, vi). This phenomenon can be linked to findings from the micro-CT analysis (Supplementary section, Fig. S4a, b). The dark area in the BSE image corresponds to the porous blue zone in the microCT image, while the lighter peripheral area matches the thin green layer at the microCT sample boundary. The elemental mapping (Supplementary section, Fig. S4c) revealed that in the darker zone, the Mg/(Al+Si) ratio ranged from 0 to 2; in contrast, in the peripheral region and at the core of the sample, this ratio varied from 0 to 0.5. Conversely, the Ca/(Al+Si) ratio in the darker zone was low, ranging from 0 to 0.2, while the ratio in the other two zones ranged from 0.1 to 1.1.

a Elemental variation (1-year exposure), b TG-DTG curve (before exposure and 1-year exposure), and (c) FTIR spectra (before exposure and 1-year exposure) of the RRC peripheral region.
The TGA analysis of the RRC peripheral region in Fig. 4b indicates that before exposure to natural seawater, there was significant weight loss between 500–680 °C, along with a minor hump at 800 °C. According to the literature, calcite, the most thermodynamically stable calcium carbonate (CaCO3) polymorph, decomposes at 720–875 °C; in contrast, the less stable polymorphs, vaterite and aragonite, decompose at 550–675 °C and 675–720 °C, respectively53. Therefore, the weight loss in the before exposure sample between 500–680 °C was attributed to the less stable CaCO3 polymorph decomposition, with some stable calcite decomposition at 800 °C (Fig. 4b). After 1 year of exposure, only the weight loss between 650–700 °C and around 800 °C was observed, indicating the conversion of less stable CaCO3 into the more stable form. Moreover, the 1-year sample displayed significant weight loss between 200–300 °C and 350–450 °C, likely due to hydrotalcite dehydroxylation54, which was not identified in the before-exposure sample. However, brucite decomposition was observed in the before-exposure sample between 340–400 °C55 reduced after 1 year of exposure, suggesting its conversion to hydrotalcite.
Confirming the TGA results, less stable aragonite presence in the before-exposure sample was verified in the FTIR analysis through the asymmetric stretching vibration (ν3) and in-plane bending vibration (ν2) of CO32− at ~1450 cm−1 and 857 cm−1. Moreover, the calcite peak observed from the asymmetric stretching vibration (ν3) and in-plane bending vibration (ν2) of CO32− at 1415 cm−1 and 872 cm−1 became sharper with the exposure duration47,56. The FTIR spectra also exhibited a broad absorption between 800 cm−1 and 1200 cm−1, corresponding to the asymmetrical stretching vibration (ν3) of the Si–O bond57. The before-exposure spectra show a broader peak for Q3 polymerization of silicates at around 990 cm−1, which shifted to 1011 cm−1 and became sharper after 1 year, indicating increased silica polymerization.
The BSE image showing the area mapping of the peripheral region of the OPC sample, exposed to seawater for 1 year, is presented in Fig. 5a. The outermost zone (beside epoxy) of the sample was Ca-rich (red layer, Fig. 5a-ii, iv); the EDS spectra confirm this zone to be a CaCO3 layer (Supplementary section, Fig. S5a-ii). A Mg-rich layer, identified as a MgCO3 layer by EDS (Supplementary section, Fig. S5a-i), was observed adjacent to this zone (blue layer, Fig. 5a-ii, iii). The zone near this MgCO3 layer was observed to be somewhat porous; a magnified image of a small area from this zone is illustrated in Fig. 5a-vi. This zone is notably rich in Ca and low in Si; for clarity, this area has been marked with dotted lines (Fig. 5a-i, ii, iv, v). The BSE-EDS analysis identified this porous area as consisting of crystalline phases (Supplementary section, Fig. S5b). The needlelike phase had a similar composition as the thaumasite-ettringite solid solution58, containing Ca, Si, Al, Cl, and sulfur (S) with high Ca/Si (Ca/Si ~ 4) (Supplementary section, Fig. S5b-i). The whitish products contained Ca, Al, and Cl, like the composition of hydrocalumite (Supplementary section, Fig. S5b-ii).

a Elemental variation (1-year exposure), b TG-DTG curve (before exposure and 1-year exposure), and c FTIR spectra (before exposure and 1-year exposure) of the OPC peripheral region.
Thaumasite generally undergoes a four-step weight loss, with the initial loss at 133 °C attributed to loosely bound water, followed by OH− group decomposition at about 450 °C, CO2 loss at 720 °C, and SO42− decomposition to SO2(g) around 900 °C59. The TGA analysis of the OPC peripheral region after 1-year exposure indicates a weight loss between 850–980 °C, along with distinctive weight loss at around 130 °C and 720 °C (Fig. 5b) indicating thaumasite decomposition. However, thaumasite decomposition was not observed in the before-exposure OPC sample. Ettringite decomposition at 100 °C and hydrocalumite decomposition between 250–350 °C54 were noted in the OPC matrix both before exposure and after 1 year. Ettringite decomposition was significantly higher than hydrocalumite, indicating that the Cl– bound in AFm was insufficient to reduce ettringite formation, eventually leading to thaumasite formation. Weight loss between 600–700 °C from CaCO3 decomposition indicated an increase in CaCO3 in the OPC binder system after 1 year of exposure (Fig. 5b). Apart from the TGA analysis, a characteristic SO42− vibration at 1100 cm−1 indicated the presence of thaumasite and ettringite in this system (Fig. 5c). The CO32− vibration at 1415 cm−1 is due to the presence of CaCO3 and thaumasite in the matrix (Fig. 5c).
In the BSE images of the outer layer of the AAM, a whitish layer is visible next to a darker peripheral region (Fig. 6a-i). Area mapping reveals this whitish region to have a high Ca-concentration, represented as a dark red layer (Fig. 6a-ii, iv). Adjacent to this Ca-rich layer is another layer with higher Mg content, depicted as a dark blue layer (Fig. 6a-ii, iii). The intensity of Si and Al remained relatively uniform. TGA analysis showed CaCO3 decomposition in the AAM sample after 1 year of seawater exposure, observed from the weight loss between 650–700 °C and 700–900 °C (Fig. 6b). Therefore, C-S-H carbonation may have allowed Mg to enter the gel phase, increasing M-S-H in the adjacent layer and creating a Mg-rich area (blue layer, Fig. 6a-ii, iii). A significant weight loss between 30–200 °C due to the C-S-H and C4AH13 decomposition18 was noted in the sample before exposure (Fig. 6b). However, after 1 year, this weight loss peak became broader, while the weight loss increased between 250–450 °C because of hydrocalumite decomposition. This broadening of the 30–200 ºC peak may have resulted from the conversion of C4AH13 into hydrocalumite. Agreeing with the TGA results, the FTIR spectra in Fig. 6c also showed a Q2 silica polymerization peak at 953 cm−1, which was sharper in the pre-exposure spectra and became broader after one year. Furthermore, the calcite peak was confirmed in both pre-exposure and post-exposure FTIR spectra by observing the asymmetric stretching vibration (ν3) and in-plane bending vibration (ν2) of CO32− at 1412 cm−1 and 871 cm−1 (Fig. 6c).

a Elemental variation (1-year exposure), b TG-DTG curve (before exposure and 1-year exposure), and c FTIR spectra (before exposure and 1-year exposure) of the AAM peripheral region.
Mechanical performance
Figure 7a illustrates the seawater-exposed mortar compressive strength for up to 1 year. After 28 days of laboratory curing, the initial compressive strength for RRC, OPC, and AAM was observed to be 40, 45, and 34 MPa, respectively. Over time, both OPC and RRC samples showed a gradual increase in strength. Notably, during the one-year seawater exposure, the samples experienced a cold cycle, with surface water temperatures dropping from 28–30 °C to around 16 °C during winter60. However, neither sample exhibited any significant reduction in strength at the 1-year mark compared to the 5-month mark, indicating no adverse effect from the temperature drop. OPC samples demonstrated the highest strength, reaching 68 MPa after 1 year. Meanwhile, RRC samples also performed well, achieving a 55 MPa compressive strength after 1 year, 19% lower than the OPC mortar. The AAM mortar’s compressive strength increased slightly after 5 months to 39 MPa, but decreased to 35 MPa after 1 year. Notably, the full-depth crack in the microCT image of the 25 x 25 x 25 mm³ OPC paste sample (Fig. 3b) did not impact the compressive strength of the 75 mm × 150 mm cylindrical mortar and concrete samples. Since paste samples consist solely of hydrated binder without aggregates, they are more reactive and exhibit lower resistance to cracking compared to mortar samples. Additionally, small paste samples have a higher surface-to-volume ratio than cylindrical ones, leading to faster seawater diffusion. This led to increased exposure effects in the paste samples, which may weaken the mechanical strength of the cylinders in the next couple of years.

a Compressive and b splitting tensile strengths of mortars.
As depicted in Fig. 7b, the initial splitting tensile strengths of the RRC and AAM before exposure were 1.9 MPa and 1.4 MPa, respectively, which are comparatively low compared to the OPC’s strength of 2.8 MPa. For all batches except AAM, the 1-year strength was within the 5-month strength’s error bar, showing no statistically significant variation. OPC achieved the highest strength, approximately 4 MPa. RRC and AAM mortar samples demonstrated similar strengths, around 3 MPa. Interestingly, while AAM did not show improved compressive strength, its tensile strength significantly increased after one year of exposure. This anomaly requires further analysis for clarification.
Environmental impact of different binder systems under seawater exposure
Figure 8 shows the global warming potential (GWP) results of different mortar samples containing RRC, OPC, and AAM as the binder. The target compressive strength of the mortars was 30 MPa after 28 days of laboratory curing. Accordingly, the GWP of the mortar mixes required to produce 1 m3 of mortar was calculated both with and without considering the target strength as a functional parameter, as shown in Fig. 8a, b, respectively. The results indicated that RRC and AAM mortars achieved approximately 59% and 72% reductions in carbon footprint compared to OPC mortars. While producing 1 m³ of mortar resulted in carbon emissions of 470 kg CO2 eq for OPC, RRC and AAM exhibited significantly lower emissions—192 kg CO₂ eq and 131 kg CO2 eq, respectively. However, after 1 year of seawater exposure, the compressive strength of OPC increased substantially. Therefore, when the 1-year compressive strength was used as a functional parameter, the GWP of OPC was calculated as 7 kg CO2 eq/m3·MPa, whereas RRC and AAM showed values of 3.48 and 3.33 kg CO2 eq/m3·MPa, respectively (Fig. 8c). As a result, the GWP reduction of RRC and AAM compared to OPC was relatively lower, 50% and 52%, respectively. Despite having low compressive strength and requiring a higher binder content to achieve 1 MPa compressive strength, RRC and AAM showed significant GWP reduction because of lower energy requirements for their raw ingredients processing. Among the raw materials used in RRC, lime production contributed the most to carbon emissions. Additionally, the need for superplasticizers to enhance the workability of RRC—partly due to kaolin’s high specific surface area—also contributed to the increase in GWP. In the case of AAM, using NaOH as the alkali activator significantly contributed to its GWP increase. While slag served as the precursor for this binder, its impact was comparatively less due to being an industrial byproduct.

The functional unit considered: a kg/m3, b kg/m3. MPa (considering target strength 30 MPa), c kg/m3. MPa (considering 1-year compressive strength).
Evaluation of the bio-receptivity of the binder composites
Figure 9 illustrates the physical condition of mortar samples, focusing on biological growth on their surface after natural seawater exposure for up to 1 year. After 1 month, all binder systems showed barnacle formation; among them, OPC mortar had less biological growth than RRC and AAM mortars (Fig. 9a, d, g). However, barnacle growth increased in all the samples in the later exposure durations (5 months and 1 year) (Fig. 9b, c, e, f, h, i). Additionally, the samples submerged in seawater for an extended period also demonstrated the presence of polychaetes (Fig. 9b, c, e, f, h, i). The mineralized tube observed on the mortar surfaces built by these sandcastle worms (polychaetes) consists of sand and shell particles bound by a cement secreted from the worm’s thorax61. These polychaetes enhance reef complexity by creating environmental heterogeneity, which promotes biodiversity by providing new niches for various species62. Rough surfaces from polychaete formations may attract more barnacles by enhancing friction and improving the bond stability between the concrete and the barnacles63. Additionally, barnacle cyprids prefer hiding in folds or crevices for protection from predators63. Figure 9j, k, l show BSE images of the barnacle shell on the surface of different paste samples. The point EDS analysis showed the composition of these shells as calcium carbonates. The part of the shells positioned on the binder surface is named the “calcareous base plate,” and the other is called the “calcareous wall.” Barnacles utilize a proteinaceous adhesive known as barnacle cement to securely attach their bodies to nearly any substrate underwater, allowing them to adhere firmly in aquatic environments. Fig. S6 (Supplementary section) shows the existence of the adhesive glue on the edge of the barnacle; a darker region can be seen in these images on which whitish depositions are visible. The EDS shows that the darker region has phosphorus (P) and nitrogen (N) in it, and the whitish region on it is the deposition of NaCl crystals absorbed from the seawater. It can be inferred that the barnacles were cemented on the sample using this glue, and at the periphery of the barnacles, NaCl crystals adhered to this adhesive. The shells, along with their adhesive layer and the penetration of this adhesive, function as three lines of defense that safeguard concrete from the harsh marine environment31,63. Throughout these assessments, no damage to the samples due to the barnacle or other marine organism growth was observed, indicating all these composites could serve as substrates for artificial reefs while also providing coastal protection.

Barnacle and polychaete growth on OPC after (a) 1-month, b 5-month, c 1-year; on RRC (d) 1-month, e 5-month, f 1-year; on AAM (g) 1-month, h 5-month, i 1-year. BSE images of the barnacle shell on different samples (j) RRC, k AAM, l OPC.
To evaluate the efficiency of different binder systems from this study as a substratum for oyster development, hatchery-spawned oysters were settled and grown on paste samples in the laboratory for 16 weeks. Within 1 week, RRC and AAM showed signs of biological growth on their surfaces (Fig. 10a, c). Over time, the RRC exhibited the most substantial growth of oysters, fully covering its surface after 16 weeks (Fig. 10a). The AAM also displayed moderate growth after 16 weeks (Fig. 10c), in contrast to the OPC sample, which showed reduced signs of oyster development (Fig. 10b). Previous literature indicates that the pearl oyster, Pinctada martensii, exhibits a strong preference for darker substrates when settling, suggesting that habitat coloration plays a significant role in its settlement behavior64. Having a colored surface (Fig. 10a) may explain the higher settlement and growth on RRC. In contrast, AAM and OPC are primarily whitish or greyish in color (Supplementary section, Fig. S7b, c), which may have influenced the lower biological growth. However, porosity and surface roughness also play a crucial role in enhancing colonization65. Increasing porosity enhances moisture retention and the deposition of organic and inorganic particles, referred to as extrinsic bio-receptivity, while intrinsic bio-receptivity involves using pore spaces for spore deposition and as habitats for biofilm taxa65. MicroCT analysis revealed that RRC had a higher number of air voids (Fig. 3a-vii), which possibly provided a more suitable attachment surface for the oyster larvae. Biological precipitation typically favors low pH substrates, while OPC and AAM are high pH cementitious systems, with pore solution pH values of 12.6–13.5 and 13–13.8, respectively66. In contrast, the pore solution pH of RRC was measured at 10.9; the methodology for pH determination is detailed in Supplementary Section2. Therefore, it is hypothesized that the high alkalinity of OPC and AAM surfaces may have inhibited oyster growth, whereas the comparatively lower pH of RRC provided a more favorable environment for biological attachment. However, more detailed study with a larger sample number is required to fully assess the bio-receptivity of different cementitious composites.

a RRC, b OPC, c AAM. The yellow scale bar shows 25 mm.

Map indicating the location of sample placements at Baffin Bay, Texas.
link