
Nanoengineered cotton wipes for antiviral protection and environmental compatibility

Ag nanoengineering of cotton fibers
Figure 1A shows an optical microscopy image of the longitudinal view of Ag-nanoengineered cotton fibers. The incorporation of Ag nanoparticles within the cotton fibers altered their coloration, producing hues ranging from orange to dark brown. This color change is attributed to the surface plasmon resonance (SPR) of Ag nanoparticles. SPR occurs when the free conduction electrons on the nanoparticle surface interact with the electromagnetic field of incident light21. This interaction results in distinct absorption and scattering, generating vibrant colors. The shade and intensity of the color depend on factors such as particle size, shape, concentration, and the material matrix in which the nanoparticles are embedded22.

Optical microscopy images of Ag-nanoengineered cotton fibers at (A) low and (B) high magnifications. (C) Optical microscopy image of control cotton fibers at high magnification.
The observed variations in hue and shade among fibers suggest differences in their synthetic capacity. These differences arise from the in situ synthesis of Ag nanoparticles being reliant solely on the natural reducing agents present in raw cotton fibers, such as sugars, pectin, cell nuclei, protoplasm, and other metabolic byproducts. The presence of these non-cellulosic components varies between individual fibers, even within the same plant23. Fibers with higher concentrations of these non-cellulosic components exhibit increased reducing properties and subsequently synthesize greater quantities of Ag nanoparticles.
Higher magnification images were obtained to investigate the in situ formation of Ag nanoparticles within the cotton fiber microstructure, which were compared with images of untreated control cotton fibers (Fig. 1B and C, respectively). Cotton fibers are around 20 μm thick and exhibit a flattened, ribbon-like morphology. This characteristic morphology is the result of the protoplasm within the fiber’s central cavity (lumen) drying out24. Comparing the longitudinal views of treated and untreated fibers revealed that the lumen area of treated fibers displayed more pronounced coloration, indicative of increased Ag nanoparticle formation. Natural reducing agents, including protoplasm and metabolic byproducts concentrated in the lumen, facilitated the in situ synthesis of Ag nanoparticles. While some microscopic variability was observed due to the natural heterogeneity of cotton fibers, the overall loading of Ag nanoparticles is expected to be relatively consistent across fibers. This is because mature cotton fibers possess similar levels of non-cellulosic components that serve as intrinsic reducing agents. Therefore, fibers of comparable maturity and growth origin are likely to yield uniform nanoparticle formation under identical reaction conditions. Under the synthesis conditions employed in this study, the Ag nanoparticle production was quantified at 1,275 ± 32 mg/kg based on the dry weight of the fibers.
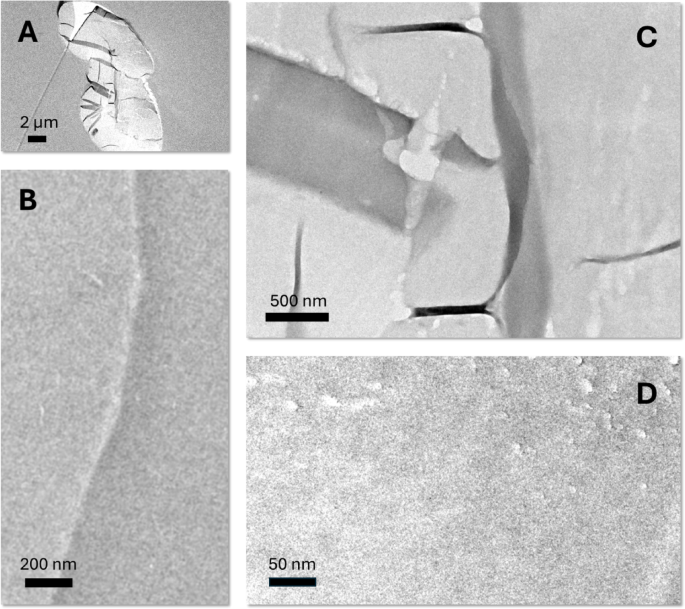
TEM images of the cross-section of control cotton fiber: (A) low-magnification image, (B) high-magnification image of the edge region, and (C, D) high-magnification images of the central region.
To investigate how Ag nanoparticles were formed across the fiber diameter, cross-sectional views of control and treated cotton fibers were examined by TEM. Figure 2 presents TEM images of control cotton fibers at various regions and magnifications. Cotton fibers have a multilayered structure including the cuticle, primary cell wall, secondary cell wall, and lumen. The cuticle and primary cell wall, which form the outer layers, contain non-cellulosic components, whereas the secondary cell wall consists of cellulose24. The lumen contains residual protoplasm and metabolic byproducts. Due to the low electron density of cellulose and non-cellulosic components, the multilayer structural details were not distinctly visible under TEM without the application of staining or other contrast-enhancing methods.
The low contrast of the cotton fiber under TEM allowed the clear visualization of Ag nanoparticles formed within the fiber matrix. Figure 3A and D show TEM images of Ag-nanoengineered cotton fibers at low magnification (Fig. 3A), at high magnification of the fiber’s outer layer (Fig. 3B), and high magnifications of the central region (lumen) (Fig. 3C and D). The images reveal that Ag nanoparticles are predominantly formed in the outer layers and lumen, confirming that natural reducing agents enabled the reduction reactions of Ag ions. The nanoparticles exhibit near-spherical morphology and are mostly individually dispersed, indicating that the in situ synthesis of nanoparticles within cotton fibers does not require stabilizing agents.
The SAED analysis validated that the particles embedded in the fiber are composed of elemental Ag, This is evidenced by four distinct concentric diffraction rings corresponding to the (1 1 1), (2 0 0), (2 2 0), and (3 1 1) planes of the face-centered cubic (fcc) crystalline structure of Ag (Fig. 3E and F). The weak diffraction spots likely result from the small size of the nanoparticles within the cotton fiber matrix. Figure 3G shows a histogram of the nanoparticle size distribution, fitted to a Gaussian function. From multiple TEM images, the average diameter of the Ag nanoparticles was determined to be 22.7 ± 7.5 nm.

TEM images of the cross-section of Ag-nanoengineered cotton fiber: (A) low magnification image, (B) high magnification image of the edge region, (C, D) high magnification images of the central region. SAED patterns of Ag-nanoengineered cotton fiber (E) without and (F) with marked rings indicating the diffraction planes of Ag nanoparticles. (G) Histogram of the Ag nanoparticle size distribution, with the solid line representing a Gaussian fit.

(A) 3D optical profile, (B) optical microscopy image, and (C) microstructure analysis of a hydroentangled nonwoven wipe fabricated from a 20 wt% blend of Ag nanoengineered cotton fibers.
Ag-engineered cotton wipes
Ag-engineered cotton nonwoven wipes were fabricated using a hydroentanglement process in a pilot plant. In this process, 20 wt% Ag-nanoengineered cotton fibers were uniformly blended with 80 wt% control cotton fibers through three rounds of carding. The resultant blended fiber web underwent hydroentanglement. For comparison purposes, control nonwoven wipes were fabricated from control cotton fibers alone. The Ag concentration in the resultant wipes was 225 ± 18 mg/kg. Figure 4 shows the microstructure of the resulting wipes, as analyzed through 3D optical profiling. The thickness of the fabricated wipes was approximately 0.6 mm. The hydroentanglement process effectively interlocked the fibers, producing a cohesive fabric structure. High-pressure water jets (9 MPa) penetrated the fiber web, which created localized perforations. These perforations were elongated, likely due to the motion of the web during hydroentanglement, which caused stretching along the direction of movement. The perforations exhibited relatively uniform size and distribution, indicating the efficiency of the hydroentanglement process in producing consistent nonwoven fabrics while maintaining structural integrity from short staple cotton fibers. Previous studies25,26,27 have demonstrated that hydroentangled nonwoven fabrics made from cotton fibers exhibited mechanical and physical properties comparable to those of competitive nonwoven substrates, supporting their mechanical robustness and functional durability. It was also found that embedding Ag nanoparticles into cotton fibers reinforced the fibers, slightly improving their tensile strength and toughness28. Together, these results indicate the suitability of Ag-engineered cotton hydroentangled nonwoven fabrics for use in wipe applications.
Antiviral cotton wipes
The antiviral efficacy of Ag-engineered cotton wipes against Feline calicivirus was evaluated using a standardized surface time-killed test following ASTM E1053, a method designed to simulate real-world disinfection scenarios on hard, nonporous environmental surfaces. The wipes were tested in their final, ready-to-use, pre-saturated form, which reflects the typical application format of disinfectant wipes during practical use. The Ag-engineered cotton wipes were wetted in DI water. The wiping procedure is shown in Fig. 5(A). Each wipe (18 cm × 19 cm) was folded longitudinally four times, creating a final size of approximately 5 cm × 5 cm. The folded wipe was further shaped into a “U” configuration around the index finger for application. The virus film on the carrier surface was divided into two equal sections (1). The first section was wiped with three back-and-forth passes (six total motions) (2–4). The wipe was then refolded to expose a fresh, unused surface (5, 6), which was used to wipe the second section of the carrier using the same procedure (7, 8).
Figures 5(B) and 5(C) show the results of the surface time-kill test (ASTM E1053). The cytotoxicity assessment, performed using the TCID50 assay, shows that the Ag-engineered cotton wipes exhibit a cytotoxic effect of less than 0.5 log10 TCID50 per 0.1 mL. This minimal cytotoxicity suggests that the wipes have low toxicity toward the tested cell line. Figures 5(D)−5(G) show optical microscopy images comparing a healthy cell monolayer with a cell monolayer infected with Feline calicivirus. The healthy cell monolayer appears structurally intact with a smooth, homogeneous texture. In contrast, the infected cell monolayer exhibits pronounced cytopathic effects, characterized by cell weakening, lysis, and loss of structural integrity. Ag-nanoengineered cotton wipes reduced virus titers from 6.5 ± 0.37 log10 TCID50 per 0.1 mL to 4.0 ± 0.19 log10 TCID50 per 0.1 mL, representing a 2.5 log10 reduction or 99.68% virus inactivation (p < 0.01). This antiviral activity is attributed to the action of Ag+ ions, which interact with viral DNA or RNA and inhibit replication29. Moisture from the pre-saturation process promotes oxidative dissolution of silver from the surface of the embedded nanoparticles, resulting in the release of Ag+ ions onto the wipe surface. Ion release is important in both the functional performance and environmental behavior of metallic nanomaterials. Previous studies have shown that Ag+ release from Ag nanoparticles reaches equilibrium between 24 and 48 h30,31,32. In our system, the embedded nanoparticles act as a reservoir, releasing Ag+ ions upon pre-saturation, thereby charging the wipe surface with antiviral functionality prior to use. During application, the released Ag+ ions come into direct contact with viral particles. These ions interact with thiol, carboxyl, and amine groups in viral proteins and nucleic acids, leading to structural disruption and loss of infectivity29.

(A) Photographs of the wiping procedure in the virucidal efficacy test of ready-to-use, pre-saturated Ag-nanoengineered cotton wipes. (B) Cytotoxicity assessment of Ag-engineered cotton wipes and the titers of Feline calicivirus for the recovery control plate and the plate wiped with Ag-engineered cotton wipes. (C) Log reduction of Feline calicivirus after wiping with Ag-engineered cotton wipes. The number atop the bar represents the percent reduction. Optical microscopy images of (D) a healthy cell monolayer and (E) a Feline calicivirus-infected cell monolayer at 40x magnification. The boxed areas in (D) and (E) are magnified in (F) and (G), respectively, at 4x magnification.
Mineralization in compost and marine environments
Figure 6A shows the percent mineralization of starch, control cotton wipes, and Ag-engineered cotton wipes in compost. Starch, used as a positive control to validate experimental and theoretical CO2 volumes, exhibited the highest mineralization rate, with rapid mineralization observed during the first 10 days. After this initial phase, the rate declined, reaching a plateau of approximately 77% by day 20. For control cotton wipes and Ag-engineered cotton wipes, both required several days to initiate mineralization and subsequently mineralized at a slower rate compared to starch, with a slight deceleration starting around day 25. Throughout the period studied, the average percent mineralization of Ag-engineered cotton wipes was slightly lower than that of control cotton wipes. To further examine the mineralization kinetics in compost, a first-order decay model was applied. For starch, the data prior to reaching the plateau were analyzed. As shown in Fig. 6B, plotting the natural logarithms of the percent carbon remaining against time produced linear correlations for starch, control cotton wipes, and Ag-engineered cotton wipes. Regression analysis yielded coefficients of determination (R2 greater than 0.9 for all three samples, indicating first-order decay kinetics. According to the F-test, the first-order decay kinetics for control cotton wipes and Ag-nanoengineered cotton wipes were not significantly different (p = 0.8250).

(A) Percent mineralization of starch, control cotton wipes, and Ag-engineered cotton wipes as a function of days in compost. (B) Natural logarithm of the percent carbon remaining as a function of days in compost. Straight lines represent regression analysis using the first-order decay model. The starch data up to 20 days were used for regression analysis.
Figure 7A shows the percent mineralization of starch, control cotton wipes, and Ag-engineered cotton wipes in a marine environment. In comparison to compost, all samples mineralized at a slower rate, with mineralization continuing throughout the period studied. Consistent with the compost results, starch exhibited the fastest mineralization. The average percent mineralization of Ag-engineered cotton wipes remained lower than that of control cotton wipes, similar to the trend observed in compost. However, the difference between their rates was smaller in the marine environment. The plot of the natural logarithm of the percent carbon remaining versus time (Fig. 7B) also yielded linear trends, confirming that the mineralization in the marine environment adheres to first-order decay kinetics. Notably, the slopes of these trends were shallower than those observed in compost. As expected, an F-test comparing the first-order decay kinetics of control cotton wipes and Ag-nanoengineered cotton wipes produced a higher p-value (0.9958).

(A) Percent mineralization of starch, control cotton wipes, and Ag-engineered cotton wipes as a function of days in the marine environment. (B) Natural logarithm of the percent carbon remaining as a function of days in the marine environment. Straight lines represent regression analysis using the first-order decay model.
Mineralization kinetic parameters for control cotton wipes and Ag-engineered cotton wipes in compost and marine environments were compared. Figure 8A shows the induction period, which represents the time required before significant mineralization begins. This period was determined by identifying the time before a strong linear correlation (R2 > 0.9) in the fit of the first-order decay model. In the compost environment, the induction period for Ag-engineered cotton wipes was slightly longer than that of control cotton wipes (p < 0.05), indicating that Ag-engineered cotton wipes exhibited slightly higher resistance to mineralization. The release of Ag ions from the Ag nanoparticles in the moist compost environment may inhibit microbial activity, thus extending the induction period. Previous studies11,12,13,33 have demonstrated that Ag-nanoengineered cotton fabrics inhibited representative Gram-positive and Gram-negative bacteria as well as a soil-borne fungus. In the marine environment, the induction periods for both wipes were approximately three times greater than those observed in compost. The longer induction period in the marine environment can be attributed to slower microbial activity, higher salinity, and reduced nutrient availability, all of which hinder microbial mineralization. The difference in induction period between control cotton wipes and Ag-engineered cotton wipes was smaller in the marine environment. This reduced difference is likely due to the overall slower and less efficient microbial mineralization under marine conditions.
Figure 8B shows the rate constants of control cotton wipes and Ag-engineered cotton wipes in compost and marine environments. Although the F-tests on the first-order decay kinetics did not indicate a statistically significant difference, it was observed that the nanoengineering of cotton wipes with a low concentration of Ag nanoparticles slightly reduced the rate constant, with the effect more pronounced in the compost environment. The compost environment, which supports higher microbial activity, promotes faster mineralization, resulting in higher rate constants for both types of wipes. The marine environment, characterized by reduced microbial activity, led to lower overall rate constants. This slower mineralization process under marine conditions likely accounts for the smaller difference observed between the rate constants of control cotton wipes and Ag-engineered cotton wipes.
The maximum mineralization rate was determined by calculating the derivative of percent mineralization over time during the most rapid phase. Figure 8C shows the maximum mineralization rate and the corresponding day of occurrence for control cotton wipes and Ag-engineered cotton wipes in compost and marine environments. Consistent with other measured parameters, the maximum mineralization rates were higher in compost than in the marine environment, likely due to the environmental factors discussed earlier. Within the same environment, no significant difference was observed in the maximum mineralization rates between control cotton wipes and Ag-engineered cotton wipes. However, the time required to reach the maximum mineralization rate was significantly longer for Ag-engineered cotton wipes compared to control cotton wipes (p < 0.05). While the compost environment expedited the occurrence of the maximum mineralization rate for control cotton wipes, this effect was not observed for Ag-engineered cotton wipes. The resistance of Ag-engineered cotton wipes to microbial activity in compost may delay the onset of rapid mineralization.

(A) Induction periods, (B) rate constants, (C) maximum mineralization rates and their corresponding days of occurrence, and (D) half-lives of mineralization for control cotton wipes and Ag-engineered cotton wipes in compost and marine environments.
Figure 8D shows the half-life, calculated using Eq. (5), for control cotton wipes and Ag-engineered cotton wipes in compost and marine environments. Nanoengineering of cotton wipes resulted in a slight increase in the half-life in compost, rising from 12.9 days to 15.3 days, an increase of approximately 19%. In the marine environment, the half-life increased from 25.9 days to 28.1 days, an increase of approximately 8%. When the environment shifted from compost to marine conditions, the half-life of control cotton wipes exhibited a twofold increase, whereas Ag-engineered cotton wipes showed an 84% increase. Ag-engineered cotton wipes are expected to fully mineralize within one month in compost environments and within two months in marine environments.
link


